

Overview
Organizations are rapidly adopting modern development practices – agile development, continuous integration and continuous deployment (CI/CD), DevOps, multiple programming languages – and cloud-native technologies such as microservices, Docker containers, Kubernetes, and serverless functions. As a result, they’re bringing more services to market faster than ever. New application components are being deployed continuously for widely varying periods of time (for seconds or fractions of a second, in the case of serverless functions). Furthermore, over the last several years, enterprises have rapidly adopted cloud-native infrastructure services, such as AWS, in the form of microservice, serverless, and container technologies. The combination of time-to-market acceleration, continuous deployment, and microservices-based development has made the identification and resolution of system issues extremely challenging.
Tracing an event to its origin in these distributed systems requires thousands of processes running on the cloud, on-premise or both. But conventional monitoring techniques and tools struggle to track the many communication pathways and interdependencies in these distributed architectures.
What’s needed is higher-quality telemetry that can be used to create a high-fidelity, context-rich, fully correlated record of every application user request or transaction. This should be provided in the form of a centralized fully integrated Monitoring System that supports the monitoring, error identification, and notification of the entire system – the infrastructure, application, and data layers. Such a system would at a minimum comprise the following functional components:
- Metrics Collection Points
- Data Management Layer
- Visualization
- Alerting
The Monitoring System must be designed in such a way that it is easily extensible with respect to which system components are monitored, which data points are collected by the Monitoring System (e.g. which metrics), and where the telemetry data should be sent for analysis and visualization purposes. One of the most important responsibilities of a Monitoring System is to relieve team members from actively watching your systems so that they can pursue more valuable activities. To make this feasible, the system must be able to ask for an operator’s attention when necessary.
An effective Monitoring System will detect an entity in the system that is not working properly, and notify system support personnel of the issue so they can take corrective action. Simply put, it generates an alarm/alert (based on pre-defined rules and metric thresholds). Note that a Monitoring System is only capable of providing a description of the event – not the reason for the event. Also, a Monitoring System relies on pre-defined rules in order to identify issues in the system. A Monitoring System can only diagnose problems that are foreseen in advance (known knowns).
In order to support the ability to identify ‘unknown’ issues as well as identify the potential reasons for the erroneous event taking place, the Monitoring System must be coupled with and work hand in hand with an Observability Solution. Observability solves the problem of “unknown unknowns” by allowing one to automatically and continually grasp new types of problems as they emerge. The Vertical Relevance Observability Solutions is described in a companion document..
Prescriptive Guidance
Monitoring is the act of observing a system’s performance over time. Monitoring tools collect and analyze system data and translate it into actionable insights. Fundamentally, monitoring technologies, such as application performance monitoring (APM), can tell you if a system is up or down or if there is a problem with application performance. Monitoring data aggregation and correlation can also help you to make larger inferences about the system. Load time, for example, can tell developers something about the user experience of a website or an app.
According to the SRE book by Google, your Monitoring System needs to answer two simple questions: “What’s broken, and why?” Monitoring allows you to watch and understand your system’s state using a predefined set of metrics and logs essentially detecting a known set of failure modes.
So Why Monitor?
Monitoring is crucial for analyzing long-term trends, for building dashboards, and for alerting. It lets you know how your apps are functioning, how they’re growing, and how they’re being utilized. However, the problem with monitoring complex distributed applications is that production failures are not linear and therefore are difficult to predict.
Traditional tools for monitoring encompass everything from logging to telemetry data – context is key. Monitoring provides and answer to the question “what is down?” Context helps one in determining the “why.” As stated earlier, pairing monitoring best practices with an effective Observability Solution can both tell one something is wrong and offer rich context. Ops personnel get to the “why” faster, making it easier to arrive at the right conclusions in a timely fashion.
Importance of Telemetry Data
Using telemetry data, intelligence and analytics, engineers and SREs can implement actionable feedback loops to make infrastructure and application runtime deployment changes. Figure 1 illustrates the types of feedback loop that can be implemented using various levels of automation:
- Manual actions: telemetry data reporting and (search) analytics used by infrastructure and application teams for troubleshooting and deployment planning.
- Semi-automated actions: event policy rules and analytics that trigger workflow automation, such as pagers and tickets, which trigger manual change and troubleshooting activities by support teams.
- Automated actions: telemetry data collected and processed by platform controllers to execute automated infrastructure changes, such as autoscaling and redeployment of containers.
For the first type of feedback loop advanced telemetry data analysis is used to support manual operations and planning activities, such as log search analytics and metrics timeseries trending analysis. There are a variety of data analytics tools and services available today for advanced analysis of telemetry data. In the monitoring space, use cases for these data management capabilities were initially used by full stack cloud engineers, especially for supporting troubleshooting activities. With the increasing adoption of cloud-native infrastructure and distributed applications, the applicability and usage scope of telemetry data analytics is expanding. Examples include use of telemetry data for digital experience monitoring and business IT-level status reporting.
For the second type of feedback loop collected telemetry event data is being used for triggering automated incident management workflows, driving and coordinating manual operations activities. For example, a node failure triggers an exception event message, causing an automated trouble ticket to be created and assigned to a platform team for further investigation. Event messages can be generated by agent instrumentation (i.e., native events) or generated as part of processing of collected telemetry data (i.e., synthetic threshold alerts). New advanced data query and machine learning technologies complement existing alert processing functionality, such as contextual filtering and deduplication. Telemetry event data can now be processed more effectively and, as a result, optimize incident management workflows that are being triggered by alerting.
Solution-Based Approach to Monitoring
This document covers monitoring, from an implementation perspective. The monitoring process will be addressed with respect to:
- Detail the datapoints that are collected by the monitoring process (events/metrics, logs, traces).
- Provide a detailed taxonomy of the monitored elements.
- Describe the monitoring (collection) tools that can be employed in supporting the monitoring process.
- Describe how these tools can be combined to support various Monitoring scenarios and how this process can be automated – both with respect to the actual monitoring and also the building of the tools.
- Describe how alerts can be triggered based on data collection driven by the monitoring process.
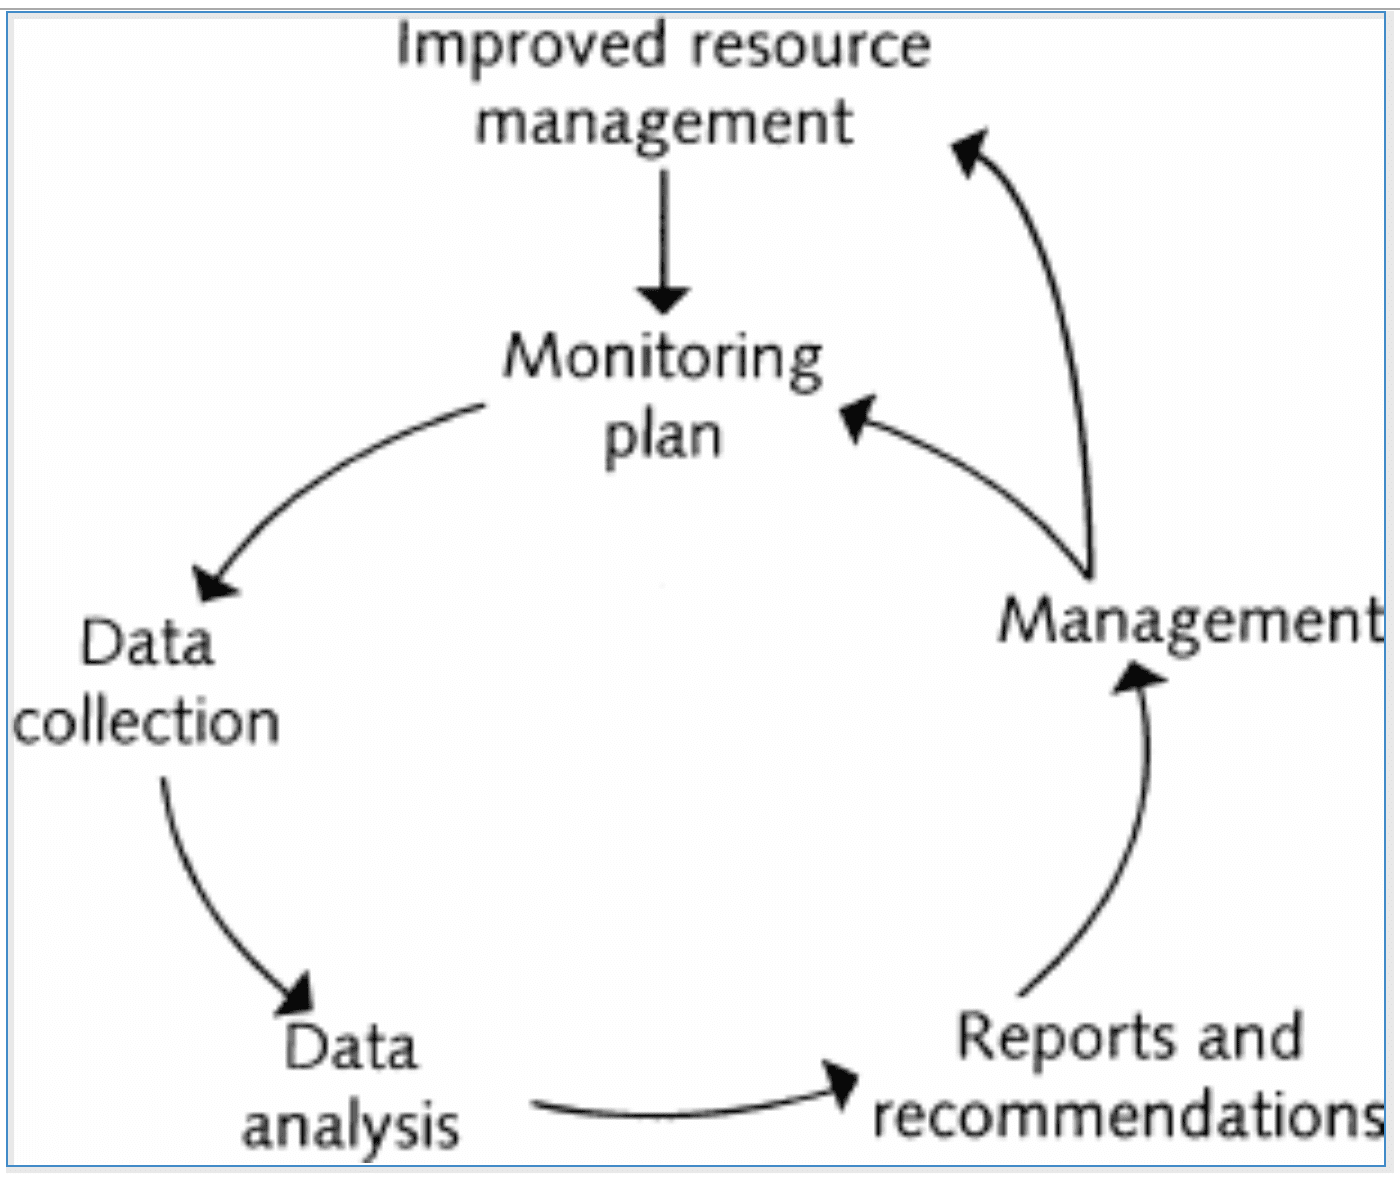
Figure-01
Best Practices
Monitoring Plan
Before implementing a monitoring process one must create a monitoring plan. This plan should answer the following questions:
- What are your monitoring goals?
- Which resources will you monitor?
- How often will you monitor these resources?
- Which monitoring tools will you use?
- Who will perform the monitoring tasks?
- Whom should be notified when something goes wrong?
Metrics
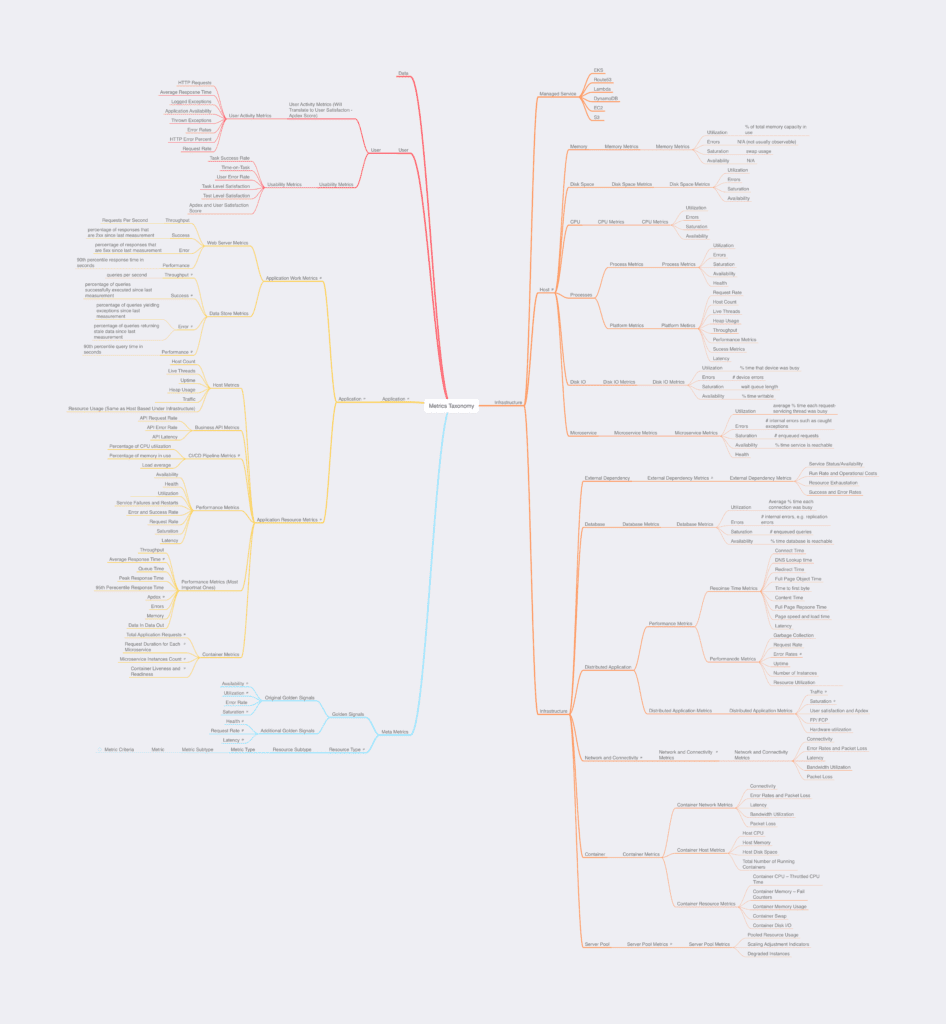
One cannot really begin system monitoring without a thorough understanding of system metrics. Metrics are raw data that can be collected from various sources. These sources can be hardware, sensors, applications, websites, etc. The data that these sources produce can be, for example, resource usage, performance, or behavior of users. This can be data provided by the operating system, or it can be higher-level data types tied to a specific functionality or component operation, for example, the number of active users on a site, or page load time. In general, metrics are collected on a periodical basis, for example, once a second, once a minute, or any other period, depending on the characteristics of the indicators and the goals of metrics monitoring. Metrics will be discussed in much more detail the later sections of this document. A metrics taxonomy has been developed by the authors of this document. This taxonomy will be leveraged in developing the monitoring scenarios/blueprints detailed in later in this document. The metrics taxonomy is illustrated in Figure 2. A tabular version of the taxonomy is also available – which includes descriptions for the metrics. This can be found in a separate file – Metrics Taxonomy.
Monitoring
While metrics represent the data in your system, monitoring is the process of collecting, aggregating, and analyzing those values to improve awareness of your components’ characteristics and behavior. The data from various parts of your environment are collected into a Monitoring System that is responsible for storage, aggregation, visualization, and initiating automated responses when the values meet specific requirements.
In general, the difference between metrics and monitoring mirrors the difference between data and information. Data is composed of raw, unprocessed facts, while information is produced by analyzing and organizing data to build context that provides value. Monitoring takes metrics data, aggregates it, and presents it in various ways that allow humans to extract insights from the collection of individual pieces. Monitoring Systems fulfill many related functions:
Their first responsibility is to accept and store incoming and historical data. While values representing the current point in time are useful, it is almost always more helpful to view those numbers in relation to past values to provide context around changes and trends. This means that a Monitoring System should be capable of managing data over periods of time, which may involve sampling or aggregating older data.
Secondly, Monitoring Systems typically provide visualizations of data. While metrics can be displayed and understood as individual values or tables, humans are much better at recognizing trends and understanding how components fit together when information is organized in a visually meaningful way. Monitoring Systems usually represent the components they measure with configurable graphs and dashboards. This makes it possible to understand the interaction of complex variables or changes within a system by glancing at a display.
An additional function that Monitoring Systems provide is organizing and correlating data from various inputs. For the metrics to be useful, administrators need to be able to recognize patterns between different resources and across groups of servers. For example, if an application experiences a spike in error rates, an administrator should be able to use the Monitoring System to discover if that event coincides with the capacity exhaustion of a related resource.
Finally, Monitoring Systems are typically used as a platform for defining and activating alerts.
Types of Monitoring
Hardware monitoring tools capture data from the sensors that can be found in computers and other machines. These can include battery life data, power and load sensors, current and voltage sensors, fan speed sensors and user-defined artificial sensors that collect data on the operating system. Monitoring fan sensors, for example, can help you identify a malfunctioning fan before its failure causes a server or computer to overheat.
Network monitoring helps to verify that your organization’s internal network is functioning appropriately and delivering the expected levels of speed and performance. With IT infrastructure monitoring tools, you can track the transfer rates and connectivity levels that users are experiencing on the network, as well as monitoring incoming and outgoing connections. Network monitoring can help your IT organization respond proactively when an unauthorized user attempts to access your network.
Application monitoring is a critical aspect of IT infrastructure monitoring. Software applications deployed on your servers may be used by members of your IT organization or by customers of the business. In either case, applications represent a potential attack vector for a malicious actor and a powerful source of operational and business intelligence. With today’s IT infrastructure monitoring tools, organizations can track user behavior on applications to obtain operational insights and identify business opportunities.
What to Monitor
The Golden Signals of Monitoring
In the highly influential Google SRE (site reliability engineering) Book, the chapter on monitoring distributed systems introduces a useful framework called the four golden signals of monitoring that represent the most important factors to measure in a user-facing system. We will discuss each of these four characteristics below.
Latency
Latency is a measurement of the time it takes to complete an action. The specifics of how this is measured depends on the component, but some common analogues are processing time, response time, or travel time.
Measuring latency gives you a concrete measure of how long a specific task or action takes to complete. Capturing the latency of various components allows you to build a holistic model of the different performance characteristics of your system. This can help you find bottlenecks, understand which resources require the most time to access, and notice when actions suddenly take longer than expected. The authors of the SRE book emphasize the importance of distinguishing between successful and unsuccessful requests when calculating latencies, as they can have very different profiles that might skew the averages of a service.
Traffic
Traffic measures the “busyness” of your components and systems. This captures the load or demand on your services so that you can understand how much work your system is currently performing.
Sustained high or low traffic numbers can indicate that the service might need more resources or that a problem is preventing traffic from being routed correctly. However, for the majority of cases, traffic rates will be most useful in helping understand issues surfaced through other signals. For example, if latency increases beyond an acceptable level, being able to correlate that time frame with a spike in traffic is helpful. Traffic can be used to understand the maximum amount of traffic that can be handled and how the service degrades or fails at various stages of load.
Errors
It is important to track errors to understand the health of your components and how frequently they are failing to respond to requests appropriately. Some applications or services expose errors in clean, ready-made interfaces, but additional work may be required to gather the data from other programs.
Distinguishing between different types of errors can make it easier to pinpoint the exact nature of problems that are impacting your applications. This also gives you flexibility in alerting. You might need to be alerted immediately if one type of error appears, but for another, you might not be concerned as long as the rate is below an acceptable threshold.
Saturation
Saturation measures how much of a given resource is being used. Percentages or fractions are frequently used with resources that have a clear total capacity, but more creative measurements might be needed for resources with less well-defined maximum.
Saturation data provides information about the resources that a service or application depends on to operate effectively. Since a service provided by one component may be consumed by another, saturation is one of the glue metrics that surfaces the capacity problems of underlying systems. As such, saturation and latency problems in one layer might correspond with a marked increase in traffic or error measurements in the underlying layer.
Events
In addition to metrics, which are collected more or less continuously, some Monitoring Systems can also capture events: discrete, infrequent occurrences that can provide crucial context for understanding what changed in your system’s behavior. Some examples:
- Changes: Internal code releases, builds, and build failures
- Alerts: Internally generated alerts or third-party notifications
- Scaling events: Adding or subtracting hosts
An event usually carries enough information that it can be interpreted on its own, unlike a single metric data point, which is generally only meaningful in context. Events capture what happened, at a point in time, with optional additional information. For example:
Events are sometimes used to generate alerts—someone should be notified of events such as the third example in the table above, which indicates that critical work has failed. But more often they are used to investigate issues and correlate across systems. In general, think of events like metrics—they are valuable data to be collected wherever it is feasible.
Alerting
Alerting is the responsive component of a Monitoring System that performs actions based on changes in metric values. Alerts definitions are composed of two components: a metrics-based condition or threshold, and an action to perform when the values fall outside of the acceptable conditions.
While Monitoring Systems are incredibly useful for active interpretation and investigation, one of the primary benefits of a complete Monitoring System is letting administrators disengage from the system. Alerts allow you to define situations that make sense to actively manage, while relying on the passive monitoring of the software to watch for changing conditions.
While notifying responsible parties is the most common action for alerting, some programmatic responses can be triggered based on threshold violations as well. For instance, an alert that indicates that you need more CPU to process the current load can be responded to with a script that auto-scales that layer of your application. While this isn’t strictly an alert since it doesn’t result in a notification, the same Monitoring System mechanism can often be used to kick off these processes as well.
However, the main purpose of alerting is still to bring human attention to bear on the current status of your systems. Automating responses is an important mechanism for ensuring that notifications are only triggered for situations that require consideration from a knowledgeable human being. The alert itself should contain information about what is wrong and where to go to find additional information. The individual responding to the alert can then use the Monitoring System and associated tooling like log files to investigate the cause of the problem and implementing a mitigation strategy.
Infrastructure of even moderate complexity requires distinctions in alert severity so that the responsible teams or individuals can be notified using methods appropriate to the scale of the problem. For instance, rising utilization of storage might warrant a work ticket or email, while an increase in client-facing error rates or unresponsiveness might require sending a page to on-call staff.
Automated alerts are essential to monitoring. They allow you to spot problems anywhere in your infrastructure, so that you can rapidly identify their causes and minimize service degradation and disruption. Alerts draw human attention to the particular systems that require observation, inspection, and intervention.
But alerts aren’t always as effective as they could be. In particular, real problems are often lost in a sea of noisy alarms. This article describes a simple approach to effective alerting, regardless of the scale of the systems involved. In short:
- Alert liberally; page judiciously
- Page on symptoms, rather than causes
Attributes of an Effective Monitoring System
While each monitoring application or service will have its strengths and weaknesses, the best options often share some important qualities. A few of the more important characteristics to look for when evaluating Monitoring Systems are below.
Independence
One of the most basic requirements of an adequate Monitoring System is to be external to other services. While it’s sometimes useful to group services together, a Monitoring System’s core responsibilities, its helpfulness in diagnosing problems, and its relationship to the watched systems means that it’s important for your Monitoring System to be independently accessible. Your Monitoring System will inevitably have some effect on the systems it monitors, but you should aim to keep this minimal to reduce the impact your tracking has on performance and to increase the reliability of your monitoring in the event of other system problems.
Reliability
Another basic requirement is reliability. As a Monitoring System is responsible for gathering, storing, and providing access to high-value information, it is important that you can trust it to operate correctly on a daily basis. Dropped metrics, service outages, and unreliable alerting can all have an immediate harmful impact on your ability to manage your infrastructure effectively. This applies not only to the core software reliability, but also to the configuration you enable, since mistakes like inaccurate alerting can lead to a loss of trust in the system.
Facilitates Analysis
The ability to display high-level summaries and ask for greater detail on-demand is an important feature to ensure that the metrics data is useful and consumable to human operators. Designing dashboards that present the most commonly viewed data in an immediately intelligible manner can help users understand system state at a glance. Many different dashboard views can be created for different job functions or areas of interest.
Equally important is the ability to drill down from within summary displays to surface the information most pertinent to the current task. Dynamically adjusting the scale of graphs, toggling off unnecessary metrics, and overlaying information from multiple systems is essential to make the tool useful interactively for investigations or root cause analysis.
Provides Historical Data
A Monitoring System is most useful when it has a rich history of data that can help establish trends, patterns, and consistencies over long timelines. While ideally, all information would be retained indefinitely in its original granularity, cost and resource constraints can sometimes make it necessary to store older data at a reduced resolution. Monitoring Systems with the flexibility to work with data both at full granularity and in a sampled format provide a wider range of options for how to handle an ever increasing amount of data.
A related feature that is helpful is the ability to easily import existing data sets. If reducing the information density of your historic metrics is not an attractive option, offloading older data to a long-term storage solution might be a better alternative. In this case, you don’t need to maintain older data within the system, but you need to be able to reload it in bulk when you wish to analyze or use it.
Correlates Factors from Heterogenous Sources
The Monitoring System is responsible for providing a holistic view of your entire infrastructure, so it needs to be able to display related information, even if it comes from different systems or has different characteristics. Administrators should be able to glue together information from disparate parts of their systems at will to understand potential interactions and overall status across the entire infrastructure. Ensuring that time synchronization is configured across your systems is a prerequisite to being able to correlate data from different systems reliably.
Supports Addition of New Metrics/System Components
In order for your Monitoring System to be an accurate representation of your systems, you need to be able to make adjustments as the machines and infrastructure change. A minimal amount of friction when adding additional machines will help you do so. Equally important is the ability to easily remove decommissioned machines without destroying the collected data associated with them. The system should make these operations as simple as possible to encourage setting up monitoring as part of the instance provisioning or retirement process.
A related ability that is important is the ease in which the Monitoring System can be set up to track entirely new metrics. This depends on the way that metrics are defined in the core monitoring configuration as well as the variety and quality of mechanisms available to send metric data to the system. Defining new metrics is usually more complex than adding additional machines, but reducing the complexity of adding or adjusting metrics will help your team respond to changing requirements in an appropriate time frame.
Provides Alerting
As stated earlier, one of the most important aspects of a Monitoring System to evaluate is its alerting capabilities. Aside from very strict reliability requirements, the alerting system need to be flexible enough to notify operators through multiple mediums and powerful enough to be able to compose thoughtful, actionable notification triggers. Many systems defer the responsibility of actually delivering notifications to other parties by offering integrations with existing paging services or messenger applications. This minimizes the responsibility of the alerting functionality and usually provides more flexible options since the plugin just needs to consume an external API.
The part that the Monitoring System cannot defer, however, is defining the alerting parameters. Alerts are defined based on values falling outside of acceptable ranges, but the definitions can require some nuance in order to avoid over alerting. For instance, momentary spikes are often not a concern, but sustained elevated load may require operator attention. Being able to clearly define the parameters for an alert is a requirement for composing a robust, trustworthy set of alert conditions.
Components of a Monitoring System
Monitoring Systems are comprised of a few different components and interfaces that all work together to collect, visualize, and report on the health of your deployment. We will cover the basic individual parts below.
Agents and Data Exporters
While the bulk of the Monitoring System might be deployed to a dedicated server or servers, data needs to be gathered from many different sources throughout your infrastructure. To do this, a monitoring agent—a small application designed to collect and forward data to a collection endpoint—is installed on each individual machine throughout the network. These agents gather statistics and usage metrics from the host where they are installed and send them to the central monitoring software. Note that Agents and Exporters can support either a push or pull based model for data transfer.
Agents run as always-on daemons on each host throughout the system. They may include a basic configuration to authenticate securely with the remote data endpoint, define the data frequency or sampling policies, and set unique identifiers for the hosts’ data.
Metrics Taxonomy to Collection Mapping details which collection components are capable of capturing each of the metrics.
Metrics Collection Points
One of the busiest part of a Monitoring System at any given time is the metrics collection component. Because data is constantly being generated, the collection process needs to be robust enough to handle a high volume of activity and coordinate with the storage layer to correctly record the incoming data.
For both push-based and pull-based agents, the metrics collection endpoint is a central location on the network where each monitoring agent or stats aggregator sends its collected data. The endpoint should be able to authenticate and receive data from a large number of hosts simultaneously.
Data Management Layer
The data management layer’s primary responsibility is to store incoming data as it is received or collected from hosts. At a minimum, the storage layer should record the metric being reported, the value observed, the time the value was generated, and the host that produced it.
Metrics data is usually recorded in a format called a time series which represents changes in value over time. Time series databases—databases that specialize in storing and querying this type of data—are frequently used within Monitoring Systems.
For persistence over longer periods of time, the storage layer needs to provide a way to export data when the collection exceeds the local limitations for processing, memory, or storage. The data management layer also needs to provide organized access to the stored information.
Visualization
Built on top of the data management layer are the interfaces that you interact with to understand the data being collected. Since metrics are time series data, data is best represented as a graph with time on the x-axis. This way, you can easily understand how values change over time. Metrics can be visualized over various time scales to understand trends over long periods of time as well as recent changes that might be affecting your systems currently.
The visualization and data management layers are both involved in ensuring that data from various hosts or from different parts of your application stack can be overlaid and viewed holistically. Luckily, time series data provides a consistent scale which helps identify events or changes that happened concurrently, even when the impact is spread across different types of infrastructure. Being able to select which data to overlay interactively allows operators to construct visualizations most useful for the task at hand.
Alerting
One of the most important responsibilities of a Monitoring System is to relieve team members from actively watching your systems so that they can pursue more valuable activities. To make this feasible, the system must be able to ask for an operator’s attention when necessary. Monitoring Systems use user-defined metric thresholds and alert systems to accomplish this.
The alerting must be setup in such a way that it supports responsiveness without over alerting. In order for one to achieve this goal they must understand: need to understand
- which metrics are the best indications of real problems
- which problems require immediate attention
- what notification methods are best suited for different scenarios
- What levels of severity should be associated with each type of problem
Black-Box Monitoring
Black box monitoring refers to the monitoring of servers with a focus on areas such as disk space, CPU usage, memory usage, load averages, etc. These are what most in the industry would deem as the standard system metrics to monitor.
White-Box Monitoring
White box monitoring is the monitoring of applications running on a server. Monitoring based on metrics exposed by the internals of the system, including logs, interfaces like the Java Virtual Machine Profiling Interface, or an HTTP handler that emits internal statistics.
When To Use Metrics Vs Logs
When building a new application one can choose whether to implement metrics or logging.
Typically, metrics are best used for:
- Monitoring
- Profiling
- Alerting
Logs provide the extra level of detail necessary for \:
- Troubleshooting
- Debugging
- Support
- Auditing
Vertical Relevance highly recommends following foundational best practices when implementing a monitoring solution, see our curated list of best practices here.
CloudWatch Based Monitoring
This scenario describes a monitoring use case where CloudWatch is employed exclusively in monitoring EC2 instance(s).
Components
- CloudWatch Agent
- Must be running on EC2 instance(s) being monitored.
- The Agent must be restarted any time that the Configuration File is updated.
- The Agent transfers the CloudWatch Logs collected on an Instance to CloudWatch running on the server.
- CloudWatch
- Routes Events generated by EC2.
- Raises Alarms based on the metrics.
- Event
- Generated by EC2 instance
- Routed by CloudWatch based on pre-defined rule.
- Alarm – Raised By CloudWatch
- S3
- Stores the CloudWatch Configuration file.
- This file must be downloaded to the EC2 instance(s) whenever it is changed.
- This file is created by Ops personnel and stored on S3.
- Simple Email Service
- Is called by CloudWatch when an Event is generated.
- SNS
- Used to forward Alarms to Ops personnel.
How it works
- A CloudWatch agent is installed on all EC2 Instances being monitored.
- Ops Personnel create a CloudWatch Configuration file and store it in S3.
- The CloudWatch agent configuration file is downloaded from S3. (Could also add the configuration file to the MME.
- Ops Personnel define Event Generation Rules in CloudWatch.
- Ops Personnel define Alarming Rules in CloudWatch
- Alarm based on a static threshold
- Alarm based on anomaly detection
- Alarm based on a metric math expression
- Composite alarm
- Ops Personnel are subscribed to the SNS transmitted CloudWatch Alarms.
- Ops Personnel are subscribed to the CloudWatch generated Events.
- The CloudWatch Agent is started and runs continuously on the EC2 instances being monitored.
- The CloudWatch Agent forwards the logs and metrics it collects to CloudWatch on the Server.
- CloudWatch raises alerts based on metrics collected and pre-configured rules.
- CloudWatch forwards the alerts to Ops Personnel using SNS.
- CloudWatch generates events based on pre-configured rules.
- Events are forwarded from EC2 to CloudWatch.
- CloudWatch forwards the events to Ops Personnel using Simple Email Service. An alarm can also be generated based on an event.
- CloudWatch stores a copy of each event in S3.
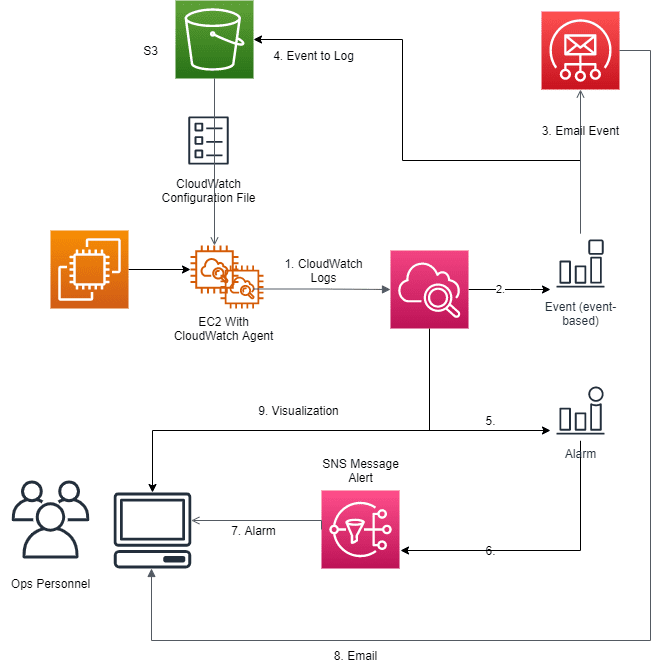
Figure-03
The following table contains list of all of the metrics that can be collected by the CloudWatch Agent running on an EC2 instance. Please note that some of these metrics were not included in the ‘base’ Metric Taxonomy. It is the responsibility of the Monitoring System Designer to determine which metrics are pertinent to the system. VR strongly recommends that the Metric Taxonomy instance for a particular system include all the metrics being employed in the monitoring.
The following table contains list of all of the metrics that can be collected by the CloudWatch Agent running on an EC2 instance. Please note that some of these metrics were not included in the ‘base’ Metric Taxonomy. It is the responsibility of the Monitoring System Designer to determine which metrics are pertinent to the system. VR strongly recommends that the Metric Taxonomy instance for a particular system include all the metrics being employed in the monitoring.
CloudWatch Agent Metrics
| Metric | Description | Unit |
| cpu_time_active | The amount of time that the CPU is active in any capacity. This metric is measured in hundredths of a second. | None |
| cpu_time_guest | The amount of time that the CPU is running a virtual CPU for a guest operating system. This metric is measured in hundredths of a second. | None |
| cpu_time_guest_nice | The amount of time that the CPU is running a virtual CPU for a guest operating system, which is low-priority and can be interrupted by other processes. This metric is measured in hundredths of a second. | None |
| cpu_time_idle | The amount of time that the CPU is idle. This metric is measured in hundredths of a second. | None |
| cpu_time_iowait | The amount of time that the CPU is waiting for I/O operations to complete. This metric is measured in hundredths of a second. | None |
| cpu_time_irq | The amount of time that the CPU is servicing interrupts. This metric is measured in hundredths of a second. | None |
| cpu_time_nice | The amount of time that the CPU is in user mode with low-priority processes, which can easily be interrupted by higher-priority processes. This metric is measured in hundredths of a second. | None |
| cpu_time_softirq | The amount of time that the CPU is servicing software interrupts. This metric is measured in hundredths of a second. | None |
| cpu_time_steal | The amount of time that the CPU is in stolen time, which is time spent in other operating systems in a virtualized environment. This metric is measured in hundredths of a second. | None |
| cpu_time_system | The amount of time that the CPU is in system mode. This metric is measured in hundredths of a second. | None |
| cpu_time_user | The amount of time that the CPU is in user mode. This metric is measured in hundredths of a second. | None |
| cpu_usage_active | The percentage of time that the CPU is active in any capacity. | Percent |
| cpu_usage_guest | The percentage of time that the CPU is running a virtual CPU for a guest operating system. | Percent |
| cpu_usage_guest_nice | The percentage of time that the CPU is running a virtual CPU for a guest operating system, which is low-priority and can be interrupted by other processes. | Percent |
| cpu_usage_idle | The percentage of time that the CPU is idle. | Percent |
| cpu_usage_iowait | The percentage of time that the CPU is waiting for I/O operations to complete. | Percent |
| cpu_usage_irq | The percentage of time that the CPU is servicing interrupts. | Percent |
| cpu_usage_nice | The percentage of time that the CPU is in user mode with low-priority processes, which higher-priority processes can easily interrupt. | Percent |
| cpu_usage_softirq | The percentage of time that the CPU is servicing software interrupts. | Percent |
| cpu_usage_steal | The percentage of time that the CPU is in stolen time, or time spent in other operating systems in a virtualized environment. | Percent |
| cpu_usage_system | The percentage of time that the CPU is in system mode. | Percent |
| cpu_usage_user | The percentage of time that the CPU is in user mode. | Percent |
| disk_free | Free space on the disks. | Bytes |
| disk_inodes_free | The number of available index nodes on the disk. | Count |
| disk_inodes_total | The total number of index nodes reserved on the disk. | Count |
| disk_inodes_used | The number of used index nodes on the disk. | Count |
| disk_total | Total space on the disks, including used and free. | Bytes |
| disk_used | Used space on the disks. | Bytes |
| disk_used_percent | The percentage of total disk space that is used. | Percent |
| diskio_io_time | The amount of time that the disk has had I/O requests queued. | Milliseconds |
| diskio_iops_in_progress | The number of I/O requests that have been issued to the device driver but have not yet completed. | Count |
| diskio_read_bytes | The number of bytes read from the disks. | Bytes |
| diskio_read_time | The amount of time that read requests have waited on the disks. Multiple read requests waiting at the same time increase the number. For example, if 5 requests all wait for an average of 100 milliseconds, 500 is reported. | Milliseconds |
| diskio_reads | The number of disk read operations. | Count |
| diskio_write_bytes | The number of bytes written to the disks. | Bytes |
| diskio_write_time | The amount of time that write requests have waited on the disks. Multiple write requests waiting at the same time increase the number. For example, if 8 requests all wait for an average of 1000 milliseconds, 8000 is reported. | Milliseconds |
| diskio_writes | The number disk write operations. | Count |
| ethtool_bw_in_allowance_exceeded | The number of packets queued and/or dropped because the inbound aggregate bandwidth exceeded the maximum for the instance.. | Count |
| FIN_WAIT1 | state during the process of closing a connection. | Count |
| FIN_WAIT2 | ||
| mem_active | The amount of memory that has been used in some way during the last sample period. | Bytes |
| mem_available | The amount of memory that is available and can be given instantly to processes. | Bytes |
| mem_available_percent | The percentage of memory that is available and can be given instantly to processes. | Percent |
| mem_buffered | The amount of memory that is being used for buffers. | Bytes |
| mem_cached | The amount of memory that is being used for file caches. | Bytes |
| mem_free | The amount of memory that isn’t being used. | Bytes |
| mem_inactive | The amount of memory that hasn’t been used in some way during the last sample period | Bytes |
| mem_total | The total amount of memory. | Bytes |
| mem_used | The amount of memory currently in use. | Bytes |
| mem_used_percent | The percentage of memory currently in use. | Percent |
| net_bytes_recv | The number of bytes received by the network interface. | Bytes |
| net_bytes_sent | The number of bytes sent by the network interface. | Bytes |
| net_drop_in | The number of packets received by this network interface that were dropped. | Count |
| net_drop_out | The number of packets transmitted by this network interface that were dropped. | Count |
| net_err_in | The number of receive errors detected by this network interface. | Count |
| net_err_out | The number of transmit errors detected by this network interface. | Count |
| net_packets_recv | The number of packets received by this network interface. | Count |
| net_packets_sent | The number of packets sent by this network interface. | Count |
| netstat_tcp_close | The number of TCP connections with no state. | Count |
| netstat_tcp_close_wait | The number of TCP connections waiting for a termination request from the client. | Count |
| netstat_tcp_closing | The number of TCP connections that are waiting for a termination request with acknowledgement from the client. | Count |
| netstat_tcp_established | The number of TCP connections established. | Count |
| netstat_tcp_listen | The number of TCP ports currently listening for a connection request. | Count |
| netstat_tcp_none | The number of TCP connections with inactive clients. | Count |
| netstat_tcp_syn_recv | The number of TCP connections waiting for connection request acknowledgement after having sent and received a connection request. | Count |
| netstat_tcp_syn_sent | The number of TCP connections waiting for a matching connection request after having sent a connection request. | Count |
| netstat_tcp_time_wait | The number of TCP connections currently waiting to ensure that the client received the acknowledgement of its connection termination request. | Count |
| netstat_udp_socket | The number of current UDP connections. | Count |
| processes_blocked | The number of processes that are blocked. | Count |
| processes_dead | The number of processes that are dead, indicated by the X state code on Linux. | Count |
| processes_idle | The number of processes that are idle (sleeping for more than 20 seconds). Available only on FreeBSD instances. | Count |
| processes_paging | The number of processes that are paging, indicated by the W state code on Linux. | Count |
| processes_running | The number of processes that are running, indicated by the R state code. | Count |
| processes_sleeping | The number of processes that are sleeping, indicated by the S state code. | Count |
| processes_stopped | The number of processes that are stopped, indicated by the T state code. | Count |
| processes_total | The total number of processes on the instance. | Count |
| processes_total_threads | The total number of threads making up the processes. This metric is available only on Linux instances. | Count |
| processes_wait | The number of processes that are paging, indicated by the W state code on FreeBSD instances. This metric is available only on FreeBSD instances, and is not available on Linux, Windows Server, or macOS instances. | Count |
| processes_zombies | The number of zombie processes, indicated by the Z state code. | Count |
| swap_free | The amount of swap space that isn’t being used. | Bytes |
| swap_used | The amount of swap space currently in use. | Bytes |
| swap_used_percent | The percentage of swap space currently in use. | Percent |
Table-01
The following table maps the components included in this Solution Scenario to each of the generic functional components required in a complete Monitoring System.
Monitoring Systems Functional Components
| Generic Component Types | Solution Component |
| Agents and Data Exporters | CloudWatch Agent |
| Metrics Collection Points | CloudWatch |
| Data Management Layer | CloudWatch |
| Visualization | CloudWatch Dashboard |
| Alerting | CloudWatch Alarms, SNS |
Table-02
Blueprint
The Monitoring Repository and adjacent Monitoring Agent Config Repository contain the code for standing up the automated monitoring solution built with AWS Cloudwatch. This cloud native automated solution hosts a single AWS Cloudwatch Agent configuration file that can be distributed to EC2 instances with user specified tags. Please see the link for the most up to date information on repository contents.
The CloudWatch based system described, will detect an entity in the system that is not working properly, and notify system support personnel of the issue so they can take corrective action. It does this by generating an alarm/alert (based on pre-defined rules and metric thresholds). This monitoring system can be easily configured with respect to the data being collected and the alarms/alerts that are triggered. It can also be extended such that it supports container monitoring along with instance monitoring – as described in the next section.
Benefits
- Realtime generated alarms based on collected metrics ensures that the appropriated personnel are made aware of system issues as soon as possible allowing them to address problems in a timely fashion.
- Flexible subscription based alarm and event distribution – supports quick and easy addition and removal of ops personnel
- Monitoring is completely independent of and external to other services – most importantly the target of the monitoring ensuring that the performance and accuracy of the data collection process is not tainted by the system being monitored or other any other system
- Monitoring System is AWS Cloud-based and thus highly reliable – this greatly minimizes the risk of a monitoring outage.
- Single copy of agent configuration file – ensuring that all instances are monitored identically and updates to the monitoring configuration only needs to be done once. This minimizes the amount of time operations personnel must spend maintaining the system. Also, less human interaction translates to less of a chance of human error.
- Integrated dashboard that provides single point of visualization and analysis of monitored data. This minimizes the amount of time that Ops personnel need to spend analyzing the data – freeing up time that can be used to solve problems and develop automation.
End Result
When exploring the implementation of an effective system monitoring solution, it becomes evident that:
- It must be a vital component of any production system especially cloud-based systems with time to market demands, a continuous deployment model, and microservice-based development.
- The requirements that define a successful monitoring system must include higher quality telemetry data and a centralized fully integrated monitoring system.
- The components which comprise a robust monitoring solution must support metrics collection points, a data management layer, a visualization component, and Alerting.
Conventional monitoring techniques cannot deal with the enormous number of ‘moving part’ in modern-day distributed architectures. Tracing an event to its origin in these distributed systems requires thousands of processes running on the target infrastructure.
These needs can only be met through the implementation of an centralized fully integrated Monitoring System designed in such a way that it is easily extensible with respect to which system components are monitored, which data points are collected by the Monitoring System , and where the telemetry data should be sent for analysis and visualization purposes. Such a system will relieve team members from actively watching the systems so that they can pursue more valuable activities.
The attributes of an effective monitoring system should include independence, reliability, the correlation of data from heterogenous sources, and support for the addition of new system components and metrics.
The guidance and best practices presented in this document will ensure that the monitoring system implemented, will lower costs, mitigate risk, and provide an optimal end-user experience.