

Overview
As organizations mature in their cloud journey, they are bound to have many workloads and resources across different AWS regions and accounts. This raises a tough challenge for the security teams to gain visibility into where the organization has the highest risks of security incidents. To avoid financial and reputational repercussions, security engineers and executives need a high-level, real-time view of their security posture within the cloud.
Security teams typically leverage a variety of inefficient, manual practices to help mitigate and reduce the risks with out-of-the-box implementations of tools like AWS Security Hub. While these tools can be useful pieces in building a security dashboard, simply enabling such services is not sufficient for organizations in highly-regulated industries. Rather, we recommend extending the capabilities of such security data aggregation services to create automated, custom-tailored dashboards that provide actionable insights for stakeholders of various levels.
Throughout this solution we will provide general guidance around building automated, actionable security dashboards and explore a sample implementation. By the end of this foundation, you will have an understanding of the code and concepts required to create an easily customizable dashboard with quantitative measurement of the security across the entire AWS Landscape. The solution will highlight the accounts, regions, and resources with highest security risks, and provide guidance as to which risks should be mitigated first.
Prescriptive Guidance
Before diving into Security Dashboard Foundation, it is important to acknowledge some terminology that we will be using throughout the solution.
Definitions
- Security Score – Provides a single, quantitative measurement of the overall health of the entire AWS landscape from security point of view.
- Control – A Security Rule against which the AWS resources are measured for compliance (e.g., Security group should not allow inbound traffic from 0.0.0.0/0 on all ports)
- Finding – Evaluation of a specific resource against a specific control (e.g., sg-1234567890abcd allows inbound traffic from 0.0.0.0/0 on all ports resulting in a FAILED finding)
- Security Standard – A set of controls (e.g., PCI-DSS, AWS Foundational Security Best Practices, CIS AWS Foundations)
- Impact Matrix – As per AWS Security Hub and industry standards, each control will have a field called “severity”. The severity of a specific control not passing is defined using two variables.
- Likelihood – Determines the likelihood of a specific security threat or gap being exploited. For example, if a public S3 bucket is storing unencrypted data, it is very likely that the data will be leaked to malicious actors.
- Impact – Determines the disruption or damage that may occur to the business or customers from a financial, productivity, reputational perspective. For example, the impact of root credentials of an AWS Account getting in the hands of a malicious actor can be catastrophic.
The severity assigned to each finding is a combination of the Likelihood and the Impact of the specific finding being exploited. The severity can be one of the five possible values Critical, High, Medium, Low, or Informational as per the table below.
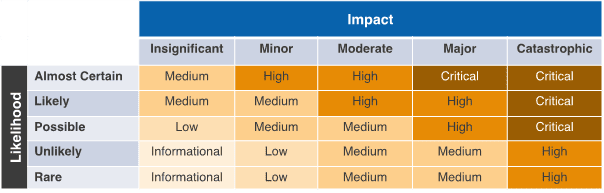
Impact Matrix
Figure-01
Best Practices
Calculating Security Scores
Security scores provided by AWS Security Hub can often be a highly unreliable metric for measuring the overall security posture of the AWS landscape. Vertical Relevance recommends using a more robust, custom-tailored scoring method since this one-size-fits-all score is not sufficient for organizations in highly-regulated industries.
Lets take a look at the AWS Security Hub scoring strategy in the image below below.
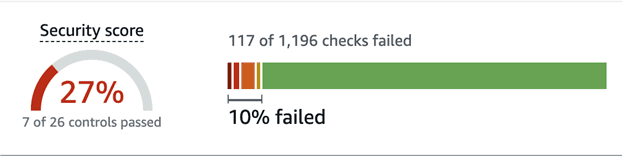
Figure-02
There are two caveats that make these scores an unreliable metric to measure the overall security posture of the AWS landscape.
- For the score on the left, showing 27% in our example, each control must pass fully for it to be reflected in the security score which can be misleading. For example, say there is a CRITICAL severity control that says no security groups should allow traffic from 0.0.0.0/0 on all ports. Let’s assume we had 100 SGs that allow traffic from 0.0.0.0/0 on all ports. Even if 99 of the SGs are fixed, the score will not update! Once the last Security Group is updated, the score will jump up. This renders the security hub security score unreliable.
- The score on the right shows that 10% of the findings failed and therefore we are at 90% passing. However, it does not consider the severity of the finding. Each finding has an equivalent weight regardless of the severity level. Critical findings have the same weight as low and informational findings, rendering this score an unreliable measurement of overall security posture.
Vertical Relevance has created a scoring method that addresses both of the above issues by considering each finding individually (rather than only considering the control) and assigning weights based on severity level. This also gives each organization the power to fine-tune their severity levels to meet their compliance standards.
See the table showing the weight for each finding below.
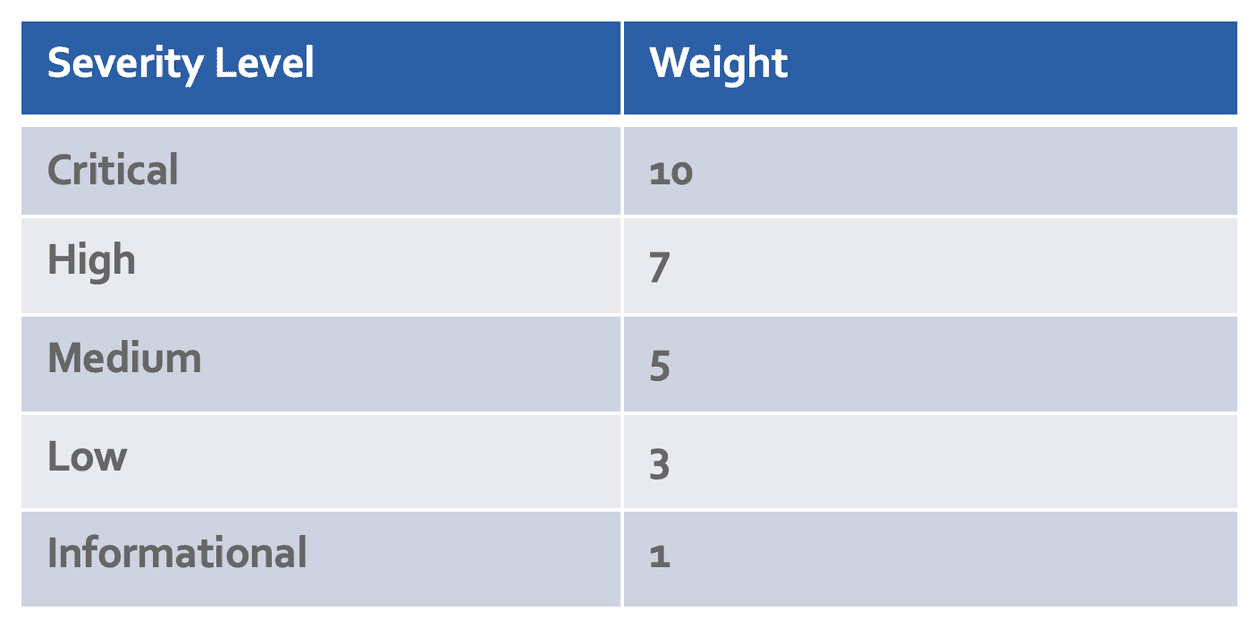
Figure-03
The score is calculated based on whether each finding passes or fails and scores are updated as each finding is updated. If a failed critical finding is fixed, the score will increase more than if a low or informational failed finding is fixed. This method provides a more accurate measurement of the overall security posture at any given point in time. It also serves as motivation for security and application engineers to fix higher severity findings first. In the above example, the calculated score is 50.2% using this method rather than the misleading 27% reported by AWS Security Hub.
Automate Findings Aggregation via Security Hub
Before deploying a dashboard, Vertical Relevance recommends that the Security Hub Findings from all accounts and regions in the organization be into a primary account’s Security Hub. At its core, Security Hub is a regional service. It has three security standards AWS Foundational Security Best Practices v1.0.0, CIS AWS Foundations Benchmark v1.2.0, and PCI (Payment Card Industries) DSS v3.2.1. These standards are a set of AWS Config rules that can be enabled with one click and it will start evaluating all the resources in that region against those rules. You can also aggregate those findings across accounts and regions. The best practice being that these are aggregated into the Security Tooling Account.
Other AWS Service and 3rd party integrations can also be integrated with AWS Security Hub for CRUD operations around the findings. It is also possible to create custom findings for the specific needs of the organization. It would be up to the Security Team to setup that infrastructure and determine which of those AWS, 3rd party or custom integration to enable.
Once the findings are aggregated in a single Security Hub region, our Security Hawk solution can swoop in to provide further insights across the entire AWS Landscape.
Single Pane of Glass
We recommend building a Single Pane of Glass solution that provides a high-level view of the overall security posture of a multi-region, multi-account AWS landscape. A single pane of glass is a management console that presents data from multiple sources in a unified display. The glass, in this case, is a computer monitor. It provides an intuitive, aggregated, graphical interface of near real-time security data that is thoughtfully laid out and easy to navigate and interpret. It is easily customizable to meet the needs of any organization. We recommend that this solution be deployed and customized as per your organizational structure and needs.
Regularly Review and Update Your Dashboard
As a single pane of glass dashboard is only use if it provides accurate and up-to-date information. We recommend that you build a solution that automatically refreshes the dashboard with the most recent security data at a rate that meets your SLA’s and regulatory requirements. Additionally, since priorities change as an organization’s cloud footprint grows, it is important to revisit the dashboard design and metrics occasionally to ensure it continues to meet expectations.
Collaborate Across Teams
When creating a dashboard, Vertical Relevance recommends involving key stakeholders from across the organization in the design and implementation of the dashboard. This helps ensure that the dashboard meets the needs of all teams and that everyone has a shared understanding of the security posture.
Security Hawk Solution
Now let’s take a look at our Security Hawk solution which is a security dashboard solution that incorporates the advanced scoring strategy and single pane of glass discussed above.
Components
- Security Hub – AWS Security Hub is the foundational service this solution is built on top of. AWS Security Hub is a cloud security posture management service that performs security best practices checks, aggregates alerts, and enables automated remediation.
- EventBridge – A serverless event bus that lets you receive, filter, transform, route, and deliver events. Security findings events from Security Hub are received by EventBridge for further processing.
- Lambda – AWS Lambda is a serverless, event-driven compute service that lets you run code for virtually any type of application or backend service without provisioning or managing servers.
- Kinesis Data Firehose Delivery Stream – Amazon Kinesis Data Firehose is a fully managed service for delivering real-time streaming data to a range of destinations. For this solution, security findings data is received by the Kinesis Firehose from EventBridge. Firehose uses AWS Lambda to process and flatten the data and then delivers it to S3 for storage and analytics.
- S3 – An object storage service offering industry-leading scalability, data availability, security, and performance. All security hub findings are delivered to and kept in S3 for analytics.
- Glue Data Catalog – A highly scalable collection of tables organized into databases. A table is metadata representation of a collection of structured or semi-structured data stored in different sources. You can then use the metadata to query and transform that data in a consistent manner across a wide variety of applications.
- Glue Crawler – A crawler is used to populate the AWS Glue Data Catalog with tables. The Glue Crawler crawls the S3 objects and updates tables schemas in Data Catalog to be used for analytics.
- Athena – A serverless, interactive query service that makes it easy to analyze data in Amazon S3 using standard SQL. It uses Glue Data Catalog schema to query specific records and fields in data stored in S3 bucket.
- Managed Grafana – A fully managed and secure data visualization service that you can use to instantly query, correlate, and visualize operational metrics, logs, and traces from multiple sources. Managed Grafana is using Athena as the source to query and visualize data.
- Amazon Quicksight – A visualization service that can be used in place of Grafana.
- Identity Center – Provides a central place that brings together administration of users and their access to AWS accounts and cloud applications. User access to the Grafana application is managed through IAM Identity Center.
How it works
The Security Hawk terraform stack should be deployed in the same region and AWS account containing the Security Hub service where findings of all regions and accounts are aggregated into. This architecture diagram and steps below illustrate how the solution operates once the terraform stack is deployed into the environment.
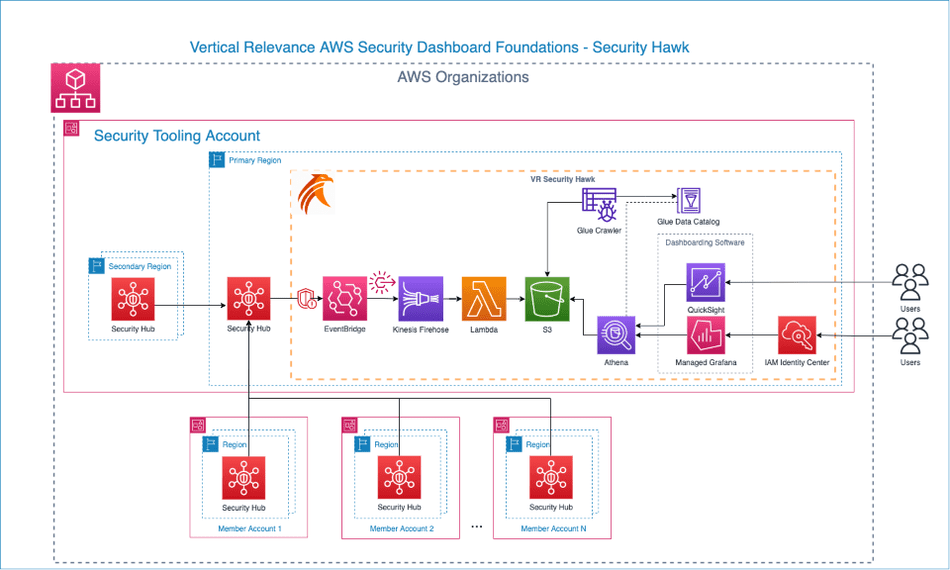
Figure-04
- Create an EventBridge Rule – Update the rule to be triggered based off AWS Security Hub findings update. According to AWS documentation, each specific finding is updated at least once per 18 hours so the EventBridge rule will be triggered when the finding is updated.
- Create a Kinesis Firehose Delivery Stream – Once the EventBridge rule is triggered it passes the event (a collection of updated findings) to the Kinesis Firehose Delivery stream to be processed and sent to the final location.
- Create a Custom Lambda to Process the Event – The above Kinesis stream triggers an AWS Lambda function to extract and transform each separate finding. The original event that Security Hub sends is deeply nested and combines anywhere from 1 to 10s of findings with a lot of unnecessary details that is not required to create a single pane of glass dashboard. Kinesis delivery stream calls the lambda function which steps through all the findings in the events, extracts only the useful information, and flattens that information in a simpler JSON format that is more suitable to perform further analytics. This transformation is crucial to be able to perform further analytics and monitoring.
- Create an S3 bucket to receive the processed event – The Lambda function delivers each finding to this S3 bucket. As all the findings are updated every 18 hours, we recommend enabling a lifecycle policy of 3 days on the S3 bucket, so all the older data is deleted every few days. Extra buffer space is added for safety. If keeping historical data is a requirement, this lifecycle policy should be adjusted accordingly.
- Create a Glue Crawler and Glue Catalog – Configure a Glue Crawler to run every hour to parse the JSON data stored in S3 and update the Glue Data Catalog containingthe JSON table schema, metadata, and database partitions. This metadata is required to perform queries against the data in S3.
- Create Athena Workgroup – The primary engine supplying all the data to the dashboard tooling of choice is Amazon Athena. Athena is looking at the schema from the Glue Catalog and querying all the data in S3. The Grafana Dashboard must have permissions to execute queries against the S3 data using the Athena Workgroup and Glue Catalog.
- Deploy the Dashboard – This solution can be implemented using either Grafana or QuickSight to visualize data.
- For Grafana, individual queries are configured in each widget. AWS IAM Identity Center, which is the newer AWS SSO, is used for authentication/authorization. Distinct levels of access to Grafana (Admin, Editor or Read-only) to users and groups. Users can quickly login via their SSO credentials. You can also set up Granular access.
- For QuickSight, the widgets are defined and configured using filters. Access to QuickSight can be directly granted from QuickSight by creating users and assigning required permissions.
Single Pane of Glass Dashboards
With all of the above in place, the final step is to integrate the Security Hawk with a dashboard to serve as a single pane of glass.
The dashboards shown below analyzes security findings from 3 different regions (us-east-1, us-east-2, and us-west-2) and 2 different accounts. This demonstrates how easily the solution can scale across an entire AWS landscape. This is also a sample dashboard which shows that it can be easily customizable for specific needs with minor tweaks to the queries and widgets. Every widget here shows the findings across the entire AWS Landscape but it’s also possible to create detailed dashboards looking at specific accounts or OUs (Organizational Unit) as well. The findings are color coded by severity to further highlight their importance.
The Security Score widget (top left) is the overall measurement of security risks of the entire landscape. It is a crucial metric and calculated differently from the Security Hub score. The Security Score Calculation section below provides further details as to how this is calculated.
Other functionality provided by other widgets is self-explanatory based on the widget title.
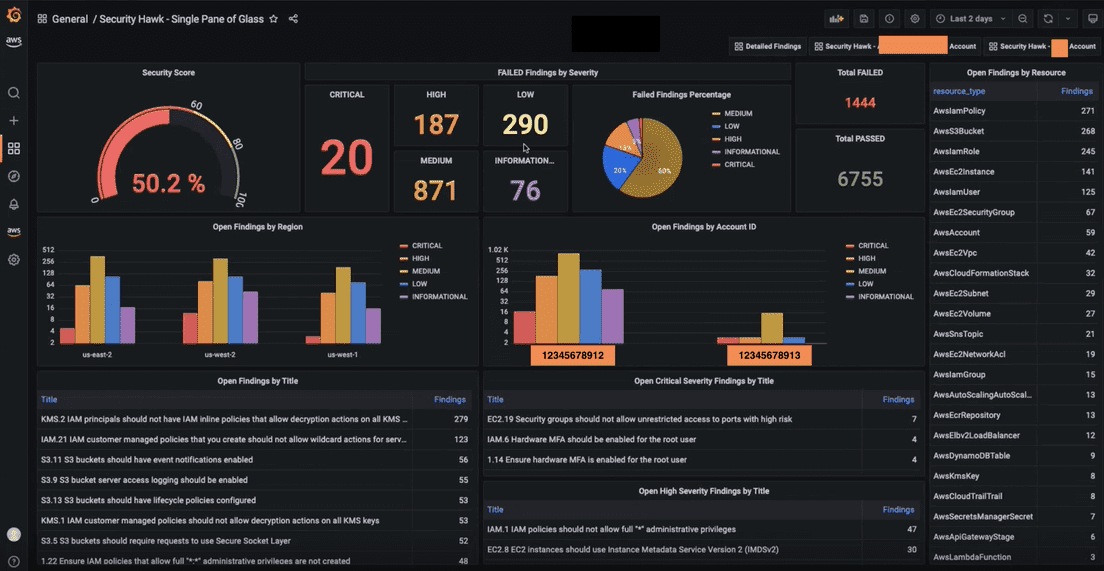
Sample Dashboard in Grafana
Figure-05
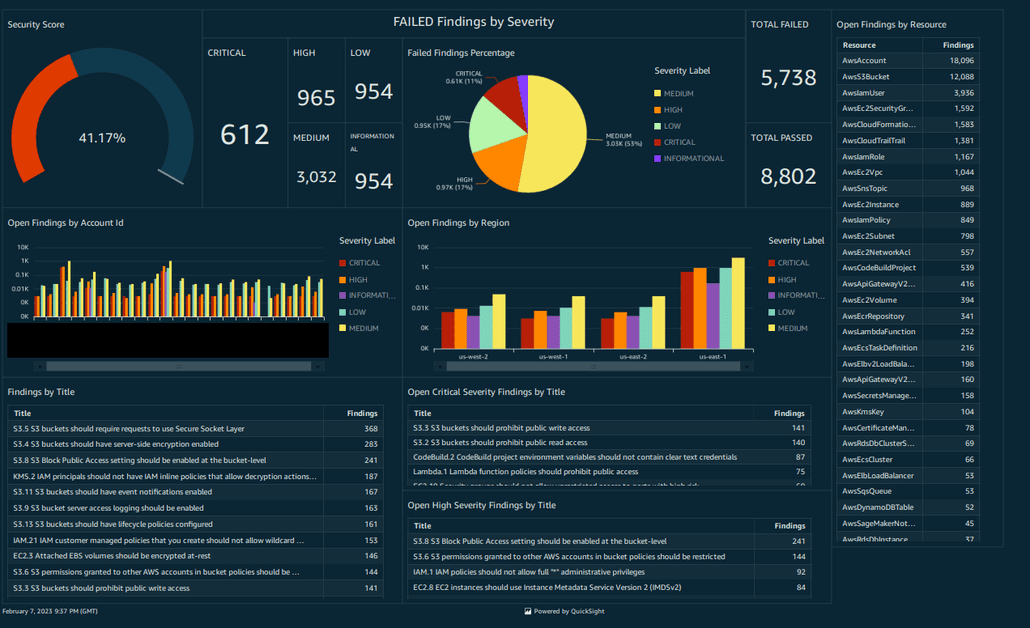
Sample Dashboard in QuickSight
Figure-06
Blueprint
This Blueprint contains the terraform code to deploy the above architecture and sample dashboards in Grafana and QuickSight.
- Security Hawk Core Infrastructure – The solution Infrastructure-as-Code (IaC) written in Terraform.
- Deploy Grafana Dashboard – Create a dashboard in Grafana using the import option.
- Deploy QuickSight Dashboard – Run the script to deploy the dashboard.
Benefits
- Creation of a single pane of glass, unified view that provides visibility into where the most security risk lies within an AWS organization.
- A single, reliable, quantitative measurement of security across your entire AWS landscape. The security score provides direct motivation for security and application engineers to improve overall security of their infrastructure.
- Ease of customizability to adapt to your organization’s needs. Custom dashboards can be quickly created for any account(s), region(s), or organizational unit(s).
- This solution is highly cost effective as all the services used are primarily event-driven and serverless to ensure cost remains low.
- Granular access can be easily provided and managed so that application teams can view their specific dashboards only.
- Using these dashboards as the scoring mechanism, an organization can also run security game days. These are internal competition to improve the overall security of the AWS landscape. Application teams would have their own dashboard with a starting security score and whichever team makes the most improvement in their score within a specified time would win the competition. The result being improvement in the overall security posture of the entire AWS landscape.
End Results
This solution addresses the crucial question that keeps organizations’ security executives up at night – “is our IT infrastructure secure and are we meeting compliance requirements?” These stakeholders are keenly aware that even the smallest security and compliance mistakes can be incredibly costly both financially and reputationally.
Luckily, with this solution executives can be more at ease because implementing Security Hawk within your AWS environment is similar to having a primary care physician monitoring your health risks 24/7, 365 days a year. As we know, physicians perform high-level checks to determine the likelihood and impact of potential illness, and depending on the severity, they prescribe more detailed tests like blood tests and x-ray scans. Similarly, the Security Hawk provides this same support by continuously monitoring, evaluating, and determining the severity of risks that affect your security posture in your AWS environments so risks can be mitigated accordingly.
This solution provides a highly customizable approach to aggregating, synthesizing, and quantifying an organization’s AWS security posture in an easily digestible format so stakeholders across the organization can quickly understand and remediate security risks.