

Overview
With the ever-growing adoption of the cloud and hybrid cloud, businesses are struggling to “connect the dots” when it comes to customer experience – regardless of whether the customer is in-house or external. The complexities that arise between ETL jobs, asynchronous, synchronous, serverless, batch, pub/sub, and countless other approaches have made application observability a broad and complex topic.
Legacy tools and approaches to application observability inherently create rigid “segments” of your application and overall digital platform. The most common way to perform root cause analysis is to gather logs from separate systems, use a text search tool like “grep” to find a pattern or specific incident, and then compare them all while trying to figure out what part of the process or application is creating the issue. This approach relies on the human aspect to fully understand what is going on, while also forcing them to ingest data from multiple systems. Not only are many tools required to peer into each tier of your application, but this approach is very timely and prone to human error.
Digital transparency and viewing your digital platform holistically are critical to application observability. Instead of having your infrastructure define your observability framework practices, we can use the concept of “spans” to define the layers and segments that make the most sense. These spans are completely user defined and are injected into specific parts of your application and infrastructure stack.
In this solution we will be breaking down application observability into its key principles then assembling these principles to see the bigger picture through a single pane of glass. We will cover many best practices around application observability then walk through a blueprint that provides the foundation for achieving digital transparency with a cloud-native approach.
Vertical Relevance’s Application Observability Foundation provides elastic, scalable application observability that gives enterprises a deep understanding of what an application is doing at any given moment without spending hours or days of effort.
Prescriptive Guidance
Before diving into application observability, it is important to understand some of its core tenets and underlying concepts. Since applications can be very complex, an understanding of tracing, memory, CPU cycles, and distributed systems will be critical to building a sufficient application observability solution.
Definitions
- Instrumentation – Measuring performance of applications with the intention of diagnosing errors and writing trace information. Instrumentation is the process of wrapping API calls, or parts of the API with special code that creates timings for further analysis
- Source Instrumentation – Measures application performance at the source level with use of symbols and custom tooling. Source code is modified
- Binary Instrumentation – Measures application performance at the interpreter level without modifying the source code. For instance, in Java applications, this would occur at the Java Virtual Machine level
- Span – A specific part of tracing that represents a functional part of the application. This can commonly be a “layer” such as the data layer, network latency layer, or application layer. The specific block of code that is being instrumented is referred to as an individual span. Effective instrumentation typically includes many, many spans across the entire codebase
- Tracing – Specialized use of logging/metrics to record information about a program’s execution. Traces are typically sent from instrumented portions of applications to downstream tools such as AWS X-Ray or Jaeger
- Open Telemetry (OTEL) – Open-source observability framework. A vendor-agnostic, industry-standard instrumentation library that supports many programming languages. At its core, OTEL is a library framework that emits an open-source protocol that other observability backends can consume. Some common backends for OTEL are Jaeger, Zipkin, DataDog, and AWS X-Ray
- Open Telemetry Protocol (OTLP) – An open-communications protocol that is represented via encoding, transport, and delivery mechanism. This is the vendor agnostic protocol that many OTEL backends can interpret
- Universally Unique Identifier (UUID) – Universally unique identifier represented in 128 bits. This is commonly used as a truly unique identifier for distributed tracing results. This UUID is correlated throughout all traces and signals so that it may be viewed as a single “request”
- Application Programing Interface (API) – Commonly a URL pattern with a defined payload, this is the interface contract which the application will behave. These are also parameter signatures within the program as well that can be instrumented
- Hypertext Transfer Protocol (HTTP) – HTTP is the webserver protocol for carrying messages such as JSON and HTML. For Observability, these requests and responses are intercepted and logged with various HTTP codes. 200 = OK, 404 = Not found, etc.
- Structured Query Language (SQL) – The code or syntax used for manipulating and querying relational databases. This is one of the hardest things to observe due to usual lack of instrumentation of SQL Databases/Engines
Design Principles/Best Practices
While it is impossible to cover all design principles and best practices within the application observability space, below are some of the most critical considerations when building an application observability solution.
Tracing (Classical)
Vertical Relevance recommends implementing common attributes of traces for all API and HTTP requests (e.g. AWS X-Ray can be used for tracing at the AWS Dynamo layer). Classical tracing techniques involve creating a UUID and carrying this UUID throughout nearly the entire request all the way down to the wire when possible. If this is not taken into consideration, we must infer the source and destination of requests or leverage login cookies to track the requests.
Tracing (Distributed)
Distributed tracing is very difficult to implement for a variety of reasons. One key issue is the lack of visibility into “black-box” cloud components that cannot easily be instrumented. For example, what information can we acquire from an AWS ALB or NLB? At first glance we are only given a couple of metrics such as response time and route information. To begin addressing the challenges of distributed tracing, we recommend tying all request metrics back to a common delimiter such as build number.
In later sections we will dive deeper into a distributed tracing implementation.
Instrumentation
Instrumentation of code can be achieved by programmatically implementing timers and wrapping functions of the code so that it can be observed. Vertical Relevance recommends that application code be instrumented across all environments (Development, UAT, Production, etc.). However, instrumentation at the interpreter/machine layer can add significant overhead in processing and result in longer execution times. Therefore, when implementing code instrumentation, you should always promote it through your lower environments first to ensure that it won’t have adverse effects on the performance of production code.
Metric Identification
Vertical Relevance recommends all aspects of the application have metrics or a metric platform available. For more details on identifying and leveraging the metrics below, please refer to Vertical Relevance’s Monitoring Foundations Solution Spotlight.
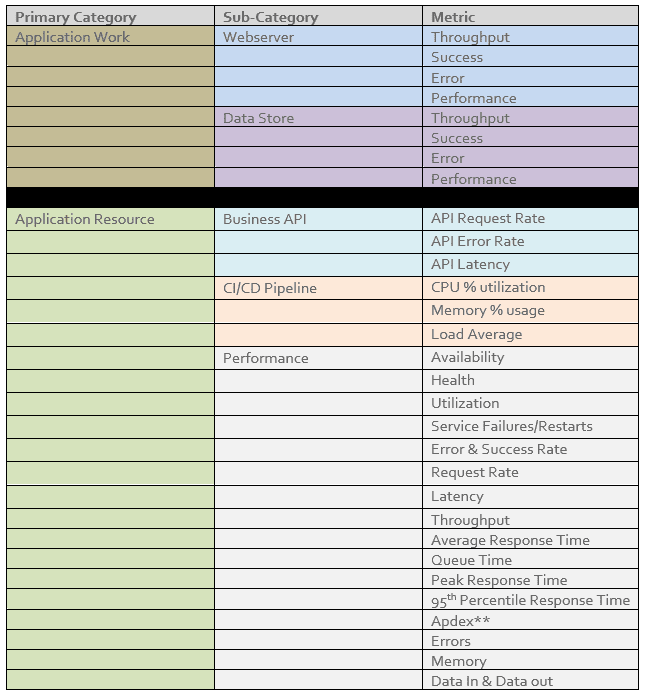
Figure-01
Segmentation
Vertical Relevance recommends that segmentation and sub-segmentation occur whenever possible. This pertains to the data access layer as well. Having your data access layer setup with a proper segment is crucial for understanding total application performance.
Modernization
Taking any monolithic app into the modern era usually involves the strangulation migration pattern. Take the greatest number of API calls and break that out. Creating what might be described as a “fat” microservice. The focus here for observability is that we are doing this modernization in a correct and performant manner.
Strive for a “Single Pane of Glass”
In observability, a single pane of glass is a centralized observability interface that contains metrics, events, logs, and/or traces. This is critical to building an observable application because systems that leverage multiple observability tools and interfaces delay response times and troubleshooting cycles. When building a single pane of glass, it is imperative to identify metrics at each layer of your application, prioritize key metrics, and create tagging strategies.
Before building your single pane of glass, we recommend identifying each layer of your application to ensure that you can comprehensively trace the application when problems arise. This is a particularly important activity because there are often more layers to trace than there are application layers. For instance, a two-tier application that is running on Amazon DynamoDB and AWS Lambda will have more than two layers to trace when you consider network latency, memory management, etc.
With the layers identified, the next step is to prioritize key metrics from each layer. Since there can be hundreds of different metrics to observe across an application, we recommend creating a list of key metrics and leveraging that list to incorporate into the primary view of the single pane of glass. To do this you must identify which signals from the application stack translate to real world impact. For instance, if a long queue does not impact the performance of the system, it is likely not a key metric, and vice versa.
Finally, with layers and key metrics identified, you must create a tagging strategy to organize your observability data so it can be easily leveraged to identify and remediate issues. While the different tags and categorization of observability data varies across different applications, we always recommend that there is a way to identify the build number of the code that produced the data. While this may seem inconsequential, knowing which version is or is not causing issues can save hours of troubleshooting.
Distributed Tracing with AWS X-Ray
Up until this point we have been discussing the foundational principles of application observability. From this point forward, we will walk through a concrete example that demonstrates how these concepts coalesce to form the full picture. We will be using OTEL to implement instrumentation on an example application and sending the telemetry data to AWS X-Ray for further processing. For this example we will be using AWS X-Ray for tracing, but it is worth noting that there are many open-source and commercial alternatives.
In this solution, we will be deploying a sample Django application, instrumenting the application to send OTEL data to AWS X-Ray, inducing load with a script that interacts with the application, and examining the traces in AWS X-Ray.
Components
- AWS CDK – This is an Infrastructure as code (IaC) technology that configures all servers, networking components, and infrastructure. We will be using CDK to deploy the components in this solution to make setup and teardown reproducible. IaC is imperative when building a repeatable reliable process to instrument code.
- AWS EC2 – This is the AWS compute service that we will be using to host the Django application that we will be instrumenting to explore distributed tracing
- AWS X-Ray – This is a service that collects telemetry data, traces, and HTTP requests and application code that allows you to filter & gain insights to identify issues with your code. X-Ray provides the capability to both automatically instrument your code to collect data on metrics such as rendering time and manually instrument it for further customization.
How it works
Before we explore how to build a single pane of glass for application instrumentation and tracing, we need an application to observe. For this demonstration, we will use a simple, Django application deployed on an EC2 instance. This application has basic polling features that allow users to vote for one of five polling options. As part of the application, we have implemented both auto-instrumentation and custom instrumentation within the application code. Below is a high-level diagram outlining the structure of our solution. Let’s dive deeper into each piece.
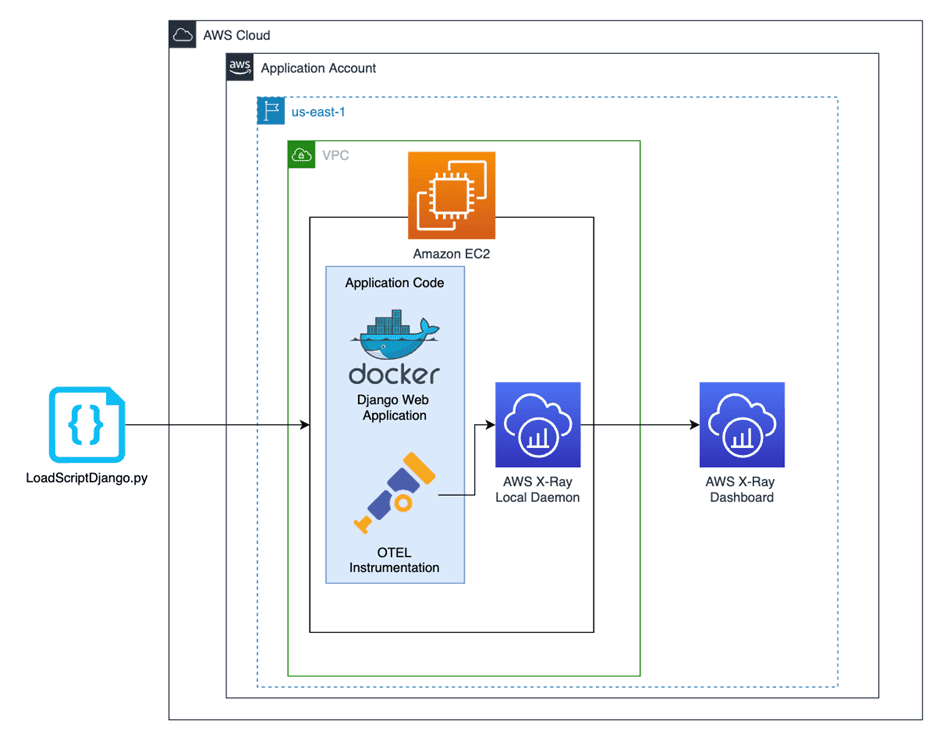
Figure-02
Deploying the Application
Before implementing distributed tracing, we must stand up the infrastructure and deploy the application code for our example. We will be deploying a Django polling application that is containerized with Docker and run on EC2. Since the application itself is not intended to be the focus of this solution, we have fully automated the configuration of the underlying cloud infrastructure (VPC, EC2, Security Groups, etc) with AWS CDK and configured the application to start running upon deployment.
As part of the configuration, we also must install the local AWS X-Ray daemon on the EC2 instance and specify which AWS region to send the AWS X-Ray traces to. This configuration step is automated by our configure.sh script that is executed as EC2 User Data at the time of deployment. The following are the commands that fetch and configure the daemon.
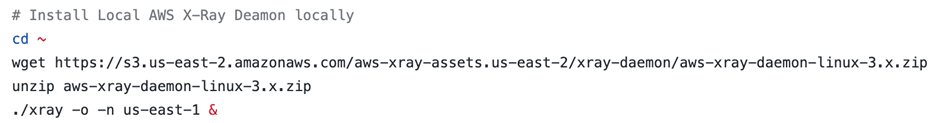
Figure-02
Configuring Auto-Instrumentation
Now that we understand how to standup the application itself, let’s explore auto-instrumentation. For python applications, configuring auto-instrumentation for AWS X-Ray is very straightforward and can provide a wide variety of useful traces across your application.
For our application, the configuration occurs in settings.py. The key components of the configuration are the following:
- Define the AWS X-Ray application
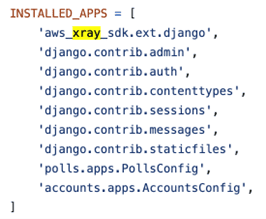
- Define the AWS X-Ray middleware
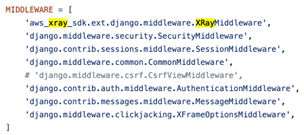
- Configure the AWS X-Ray recorder
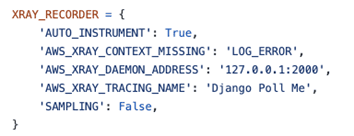
Once these are all in place, traces with metrics such as response time will captured when the application is interacted with (manually or via a load-inducing script) and can be viewed in the AWS X-Ray dashboard. Below is a sample of some of the traces captured by the auto-instrumentation.
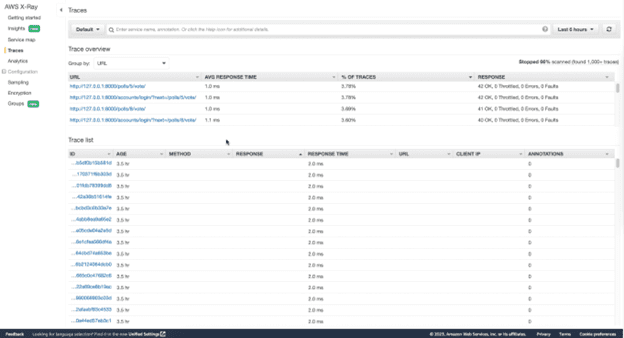
Figure-03
The top panel is the different segments and by clicking into one of them, you can see all the traces associated with the given segment. The bottom is just a full list of traces across the many segments that are created via auto-instrumentation. We will discuss this in further detail in the “Examining the Findings” section below.
Implementing Custom Instrumentation
While auto-instrumentation captures a good baseline of metrics, it is not a sufficient tracing strategy alone. To achieve the design principles of distributed tracing, you must be able to capture traces from each layer and ensure that they are key indicators of the health of your application.
For our application, we used custom instrumentation to return the request details every time a poll was completed. We accomplished this by leveraging the AWS X-Ray SDK which allows you to create an AWS X-Ray trace, isolate a single block of code, then send relevant data related to that code to AWS X-Ray as part of that trace. In our case, we sent the request from the completed poll as part of the trace. Below is a code snippet of custom instrumentation in our application.
As you can see, we are specifically targeting the polling functionality of our application, but you can use this same technique to implement tracing across any part of a codebase. Now that we have included this custom instrumentation in the application, the traces from the code snippet above will be sent to the AWS X-Ray dashboard.
Executing the Load Script
As we touched on above, load must be induced on the application to generate traces within the AWS X-Ray dashboard. While we recommend implementing load generation at scale with a tool such as JMeter or Locust, to keep it simple we used the Python requests library. The load script we created performed 1000 simulations of a user completing a poll. This is the final piece necessary to generate traces that you can investigate in the AWS X-Ray dashboard. Each time you run the load script, traces will be generated and sent to AWS X-Ray from both the auto-instrumentation and custom instrumentation that was implemented.
While this load script we have created serves the purpose of generating traces to illustrate our distributed tracing approach, the load generation necessary for a production application would need to be much more extensive to ensure that the distributed tracing strategy is working as intended. For more notes on this, please see our Performance Testing Foundations.
Examining the Findings
Now that we have an application running, instrumented code, and a script generating load, traces are being sent to our single pane of glass – AWS X-Ray. Regardless of how comprehensive your instrumentation approach is, you need to understand how to examine the findings in the dashboard to remediate application issues as they arise.
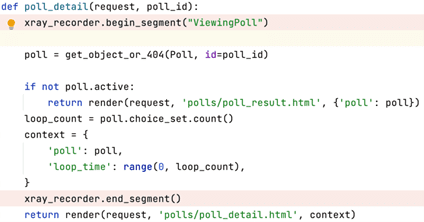
First, let’s look at the segment data provided by X-Ray for the segment we created as part of our custom instrumentation.
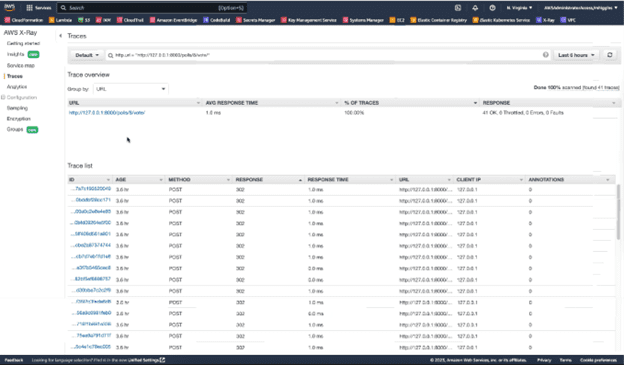
Figure-04
As you can see, the segment we defined within our code has generated 1000’s of traces because each time the segmented portion of our code is run, a trace is generated. The same can be said for the dozens of segments created by the auto-instrumentation functionality.
Now that we understand how these traces are generated, let’s dive into why they are so useful. Below is a sample trace in both its curated form and raw form.
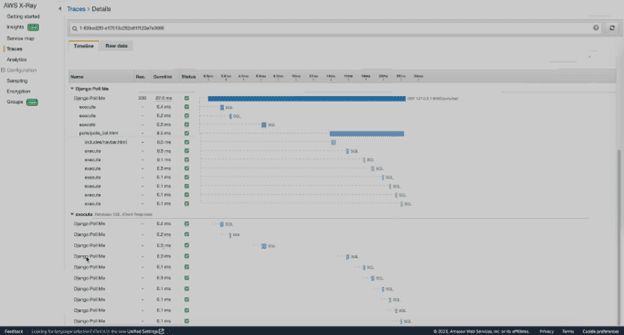
Figure-05
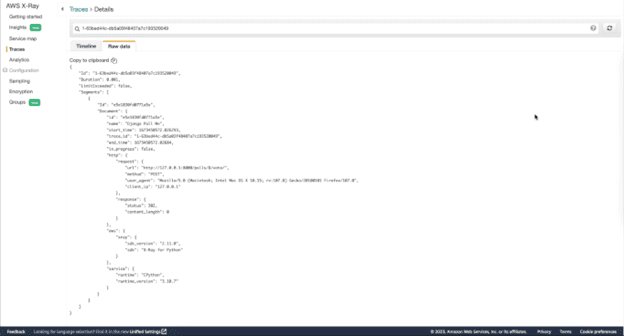
Figure-06
As you can see, each trace contains useful data about the request such as response duration, response status, and the layer in which it exists. When issues arise, it is critical to have this data on hand for key metrics at each layer of the application. While the trace data alone can be help identify issues, most tracing tools also provide maps that link traces together to help form the bigger picture. In AWS X-Ray, these are called Service Maps. Below is an example of the Service Map created by the auto-instrumentation.
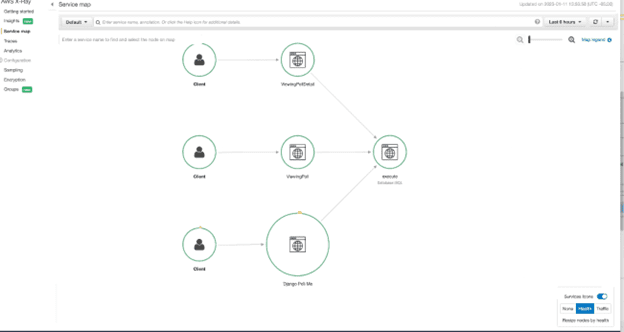
Figure-07
As you can see, it intelligently lays out the interaction between different portions of the application and how they are interdependent on each other.
As you can see, implementing a robust instrumentation strategy and leveraging a tracing tool like AWS X-Ray can be incredibly helpful when trying to improve application performance along the margins or identify and remediate issues in real time.
Blueprint
- CDK code configures and deploys an EC2 instance that hosts a simple Django application that is instrumented to send traces to AWS X-Ray. Installs the pre-requisites and deploy the sample Django application which includes both auto-instrumentation and custom instrumentation
- Application code for the Django application. The code within this directory is already instrumented as discussed in the above section.
- LoadScriptDjango.py generates load on the application by simulating a user completing a poll 1000 times. This consequently generates traces that are sent to the AWS X-Ray dashboard
Benefits
- Reduced risk between deployments – Provides observability for the entire application stack all the way down to the latency of internal API calls. This granular level of observability is critical for properly comparing performance between version releases.
- Customized Single Pane of Glass – A centralized view displays the telemetry data related to the instrumentation and traces across the entire application. Site reliability engineers and application teams can fine-tune the performance-related alerting thresholds to ensure that application issues are identified and remediated quickly
- Comprehensive Tracing Approach – Distributed tracing allows teams to see critical telemetry data at each layer to identify parts that are not performant. Without this approach, teams had to instrument the code, run it locally, and then use different tools for telemetry data such as network latency.
- Minimizes Vendor “Lock-in” – This blueprint leverages OTEL standards to instrument the application. Since OTEL is a widely compatible, open-source protocol, this minimizes vendor lock-in and allows for switching between observability tools with ease.
End Result
Vertical Relevance’s Application Observability foundation provides an intentional observability strategy that can be applied to any application across the business. By implementing instrumentation and distributed tracing as discussed throughout this solution, enterprises will be able to leverage their single pane of glass to improve performance at the margins and quickly identify and remediate application issues as they arise.