

Overview
Monitoring and auditing deployed applications are essential processes to any business that is trying to adopt cloud technology. Ensuring that diverse and separate teams build applications that meet a consistent bar for quality and service level is challenging. The effectiveness with which a company can regulate the quality of applications deployed to the cloud can make or break their cloud adoption efforts. Monitoring resiliency should be a key portion of any company’s cloud adoption efforts at scale.
The Resiliency Health Index provides a mechanism through which a client’s infrastructure, resources or applications is evaluated based on a set of automated rules to produce a weighted score indicating its resiliency and/or health. The details are then visualized and consumed through Grafana dashboards in a tiered model for Enterprise, Business Unit and Application views. This enables key executives to provide governance and assistance to their organization, while application owners are able to prioritize resiliency initiatives against business outcomes and drive continuous improvement throughout the organization.
What is Resilience?
Resilience is among the most sophisticated concerns facing a company who is building applications in the cloud. Before resilience becomes a primary concern, a company must first develop many other capabilities. Applications must be capable of achieving their basic functional requirements, they must be reliable, stable, and consistent so that they can fulfill their basic roles as products. Once these goals have been achieved, it is important to audit applications to ensure that they can stand up to and recover from common and routine challenges, edge cases, and issues as well as from rarer and more difficult problems like natural disasters, infrastructure outages, and attacks by malicious actors. Resilience involves the monitoring of many such “Non-Functional Requirements” related to application infrastructure configuration requirements, data loss under various failure modes, and service level expectations under certain exigent circumstances.
How does Resiliency Health Index help fulfill an organization’s resilience needs?
The Resiliency Health Index is about centralizing, prioritizing, and visualizing the resilience and health of applications around the organization. It is capable of pulling in data from application logs, CloudFormation stacks, CloudWatch alarms, external chaos and resilience testing frameworks, and any other data source that may be useful. Through a custom and extensible interface, organizations can assign scoring values to metrics, tests, and audits that are run on the infrastructure and applications around the organization. These scores can be summarized on different levels and categories, to give executives and leadership customizable ways for visualizing the health and resilience of cloud apps around the entire company in near-real time, as well as historically.
In addition to providing visibility on the current status of resilience, the Resiliency Health Index will also provide recommendations for how to improve your infrastructure configuration. For certain metrics, this involves comparing the system as implemented to a set of best practices and providing a text description of how to change the applications configuration to fit the best practices. For other metrics, this may involve suggestions to change the application architecture to add or replace or upgrade specific infrastructure choices.
Prescriptive Guidance
To understand why Resiliency Health Index is important to a business’ success with cloud architecture, it is important to understand what sort of company would use a solution like this. Ideally, you have a company that is mature with their cloud adoption journey. They have developed lots of cloud capabilities, teams around the company in different businesses and concerns are using the cloud for different things, and resilience is starting to become a concern that everyone is thinking about. At this point, you may have some teams that are ahead of the curve as far as resilience goes, and they have a resilient and well tested approach to application design. Other teams within the company may not be as sophisticated. As an executive concerned with operations, RHI gives you tools to assess the company’s resilience efforts. It also gives you tools to zoom in and see which teams and even which applications are falling short of resilience standards.
Definitions
- Components – Logical breakdowns of an application that can be defined by the application team implementing RHI. It can be defined as an application tier such as Front End of Back End.
- Categories – A subset of a component that can be defined that contains multiple controls and that a set of rules are aligned with to drive a category score. Examples of a categories could be application, infrastructure, observability, and operations.
- Controls – A subset of a category that is aligned with a set of rules to give a combined score that can be weighted according to the resiliency strategy of the enterprise implementing RHI. An example of controls for the Observability Category would be Metrics, Alarms, Traces, etc. Each with rules set to evaluate the health of the control.
- Resiliency Rule – An automated evaluation to determine to produce a resiliency score. Rules are aligned with controls and categories to add structure and weighted outcomes based on the organization’s required business needs. Some examples of rules would be:
- Observability metrics currently in place
- Quality of application logs
- Recovery time during real world outage
- Current continuous uptime
- Uptime percentage
- Current application health status
- Current Performance Testing pass rates
- Resiliency Testing pass rates
- Uptime percentage
- Recovery Oriented Computing – Design principles centered around resilience for cloud computing. Recovery Oriented Computing involves designing systems with adequate backups, failovers, and error handling so that your system can recover from most types of errors.
- RTO (Recovery Time Objective) – This is a metric for how long it should take from a failure for an application to return to full service. This should be directly related to the business needs and consumer expectations of an application.
- RPO (Recovery Point Objective) – During certain kinds of failures, it is very possible that data can be lost. RPO determines what level of data loss is acceptable for a particular application and failure mode. This metric can be related to how easy it is to recreate data that might be lost, how sensitive the data is, or the needs of downstream users related to consistency and availability.
- Infrastructure Auditing – Heuristic based approach which checks that infrastructure configuration aligns with best practices. These types of tests can be run directly in Resiliency Health Index and inspect infrastructure configuration as it is deployed to compare it with reference architecture. Infrastructure auditing is a great first line of testing, but it does not prove that an application is fully resilient. Some examples of infrastructure auditing could be verifying that an applications EC2 workload has an autoscaling group applied, and that.
- Chaos Testing – Broad category of tests used in resilience testing to confirm that an app can recover from challenges and failures. The point of chaos testing is to actually pull infrastructure out from a system, and observe if it can recover, and if it does, how long it takes to recover. RTO/RPO (defined above) are both common metrics for chaos tests. Some common types of chaos testing include:
- Injected application exceptions
- Database taken offline
- Network Restrictions
- High memory load
- High disk usage
- High request volume
Design Principals
Resiliency Health Index is designed to be flexible and extensible to fit varying needs of different companies. Part of the solution is a highly reusable core engine that can run scoring “rules” which aggregate up to the visualizations you see in the dashboard. The guiding principle here is that these rules are composable, so that different businesses can adapt reusable code to their needs. The rules are composed of steps, and it is also easy to add new steps in the form of python code to the solution. Between since rules are made up of steps, a new business can write rules that very closely resemble pre-built rules but that have one or two steps modified for their specific needs. This design allows RHI to adapt to many different data sources, use cases, priorities, and business focuses that different companies may have.
Resiliency Health Index
Resiliency Health Index is a tool that runs various scoring “rules” and stores the output for visualization. These rules are implemented as python modules running in an AWS lambda function. This results in the rules being able to perform any action a normal lambda function could providing almost infinite flexibility in what they can perform. From processing event input data to retrieving data from external sources to making AWS (Amazon Web Services) SDK calls.
A Health Index “application” definition contains one or more rules. Each business unit can contain multiple applications. To orchestrate the execution of application rules, an AWS step function is used. The step function is triggered on a set schedule via an AWS Eventbridge Schedule. The step function loads the application and rule definitions from DynamoDB tables and begins to iterate through all the applications defined.
For each application, the defined rules are loaded and the steps that make up the individual rule are read. The step function utilizes the step_runner lambda to import and run each step for a rule. A step can perform information gathering or evaluations on some piece of data to return a portion of the rule score. The rule returns a score value between 0 and 1 depending on the scoring step included in the rule’s definition. The two base scoring steps are average and all or nothing. Average scoring returns an average of the values returned by a rule’s steps. The all or nothing scoring treats the step results like a boolean and returns a 1 if all of a rule’s steps return a “true” response or a 0 if one or more step returns a “false” response. Through the VR Scoring Engine, rule scores are weighted according to business or environment requirements. In addition, Scoring Engine provides an application and business total weighted score for all rules and applications defined for the Automated Resiliency Health Index (ARHI) deployment.
All scores are stored in an OpenSearch domain for the deployment. The scores are then visualized using a Grafana dashboards which uses the OpenSearch domain for the deployment as a DataSource. The base dashboards provide visualizations of Health Index data that allow the user to drill down to weighted score rules through the enterprise, line of business, application and category levels.
The following is an example of what the Enterprise level dashboard looks like, using mock data, to show the aggregate scores for the lines of business that make up the deployment’s enterprise. In this example the two lines of business are PI and Brokerage.
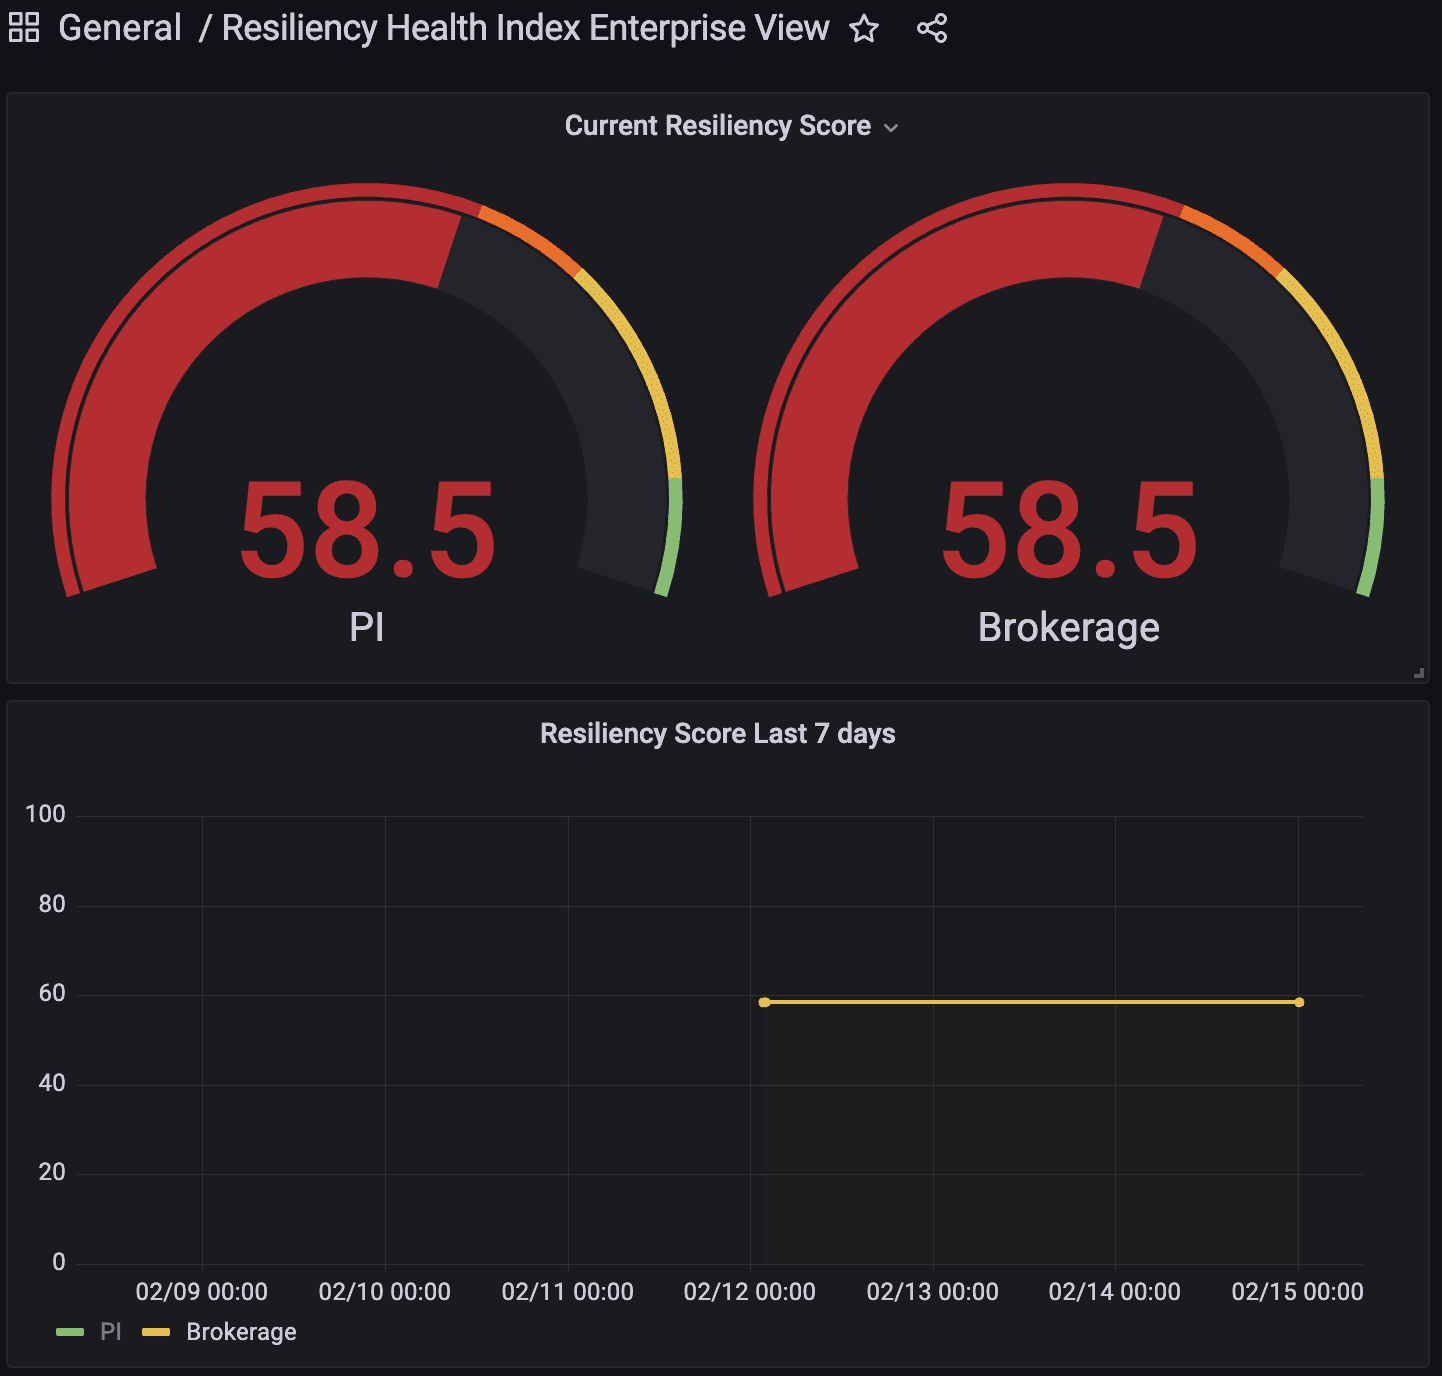
Figure-01
The below screenshot is a mocked example of a summarized, aggregated level for multiple apps in a single Line of Business (LOB) using mock data. In this example the LOB is “PI” from the enterprise dashboard example and the two applications that make up PI are Payments and Authorization.
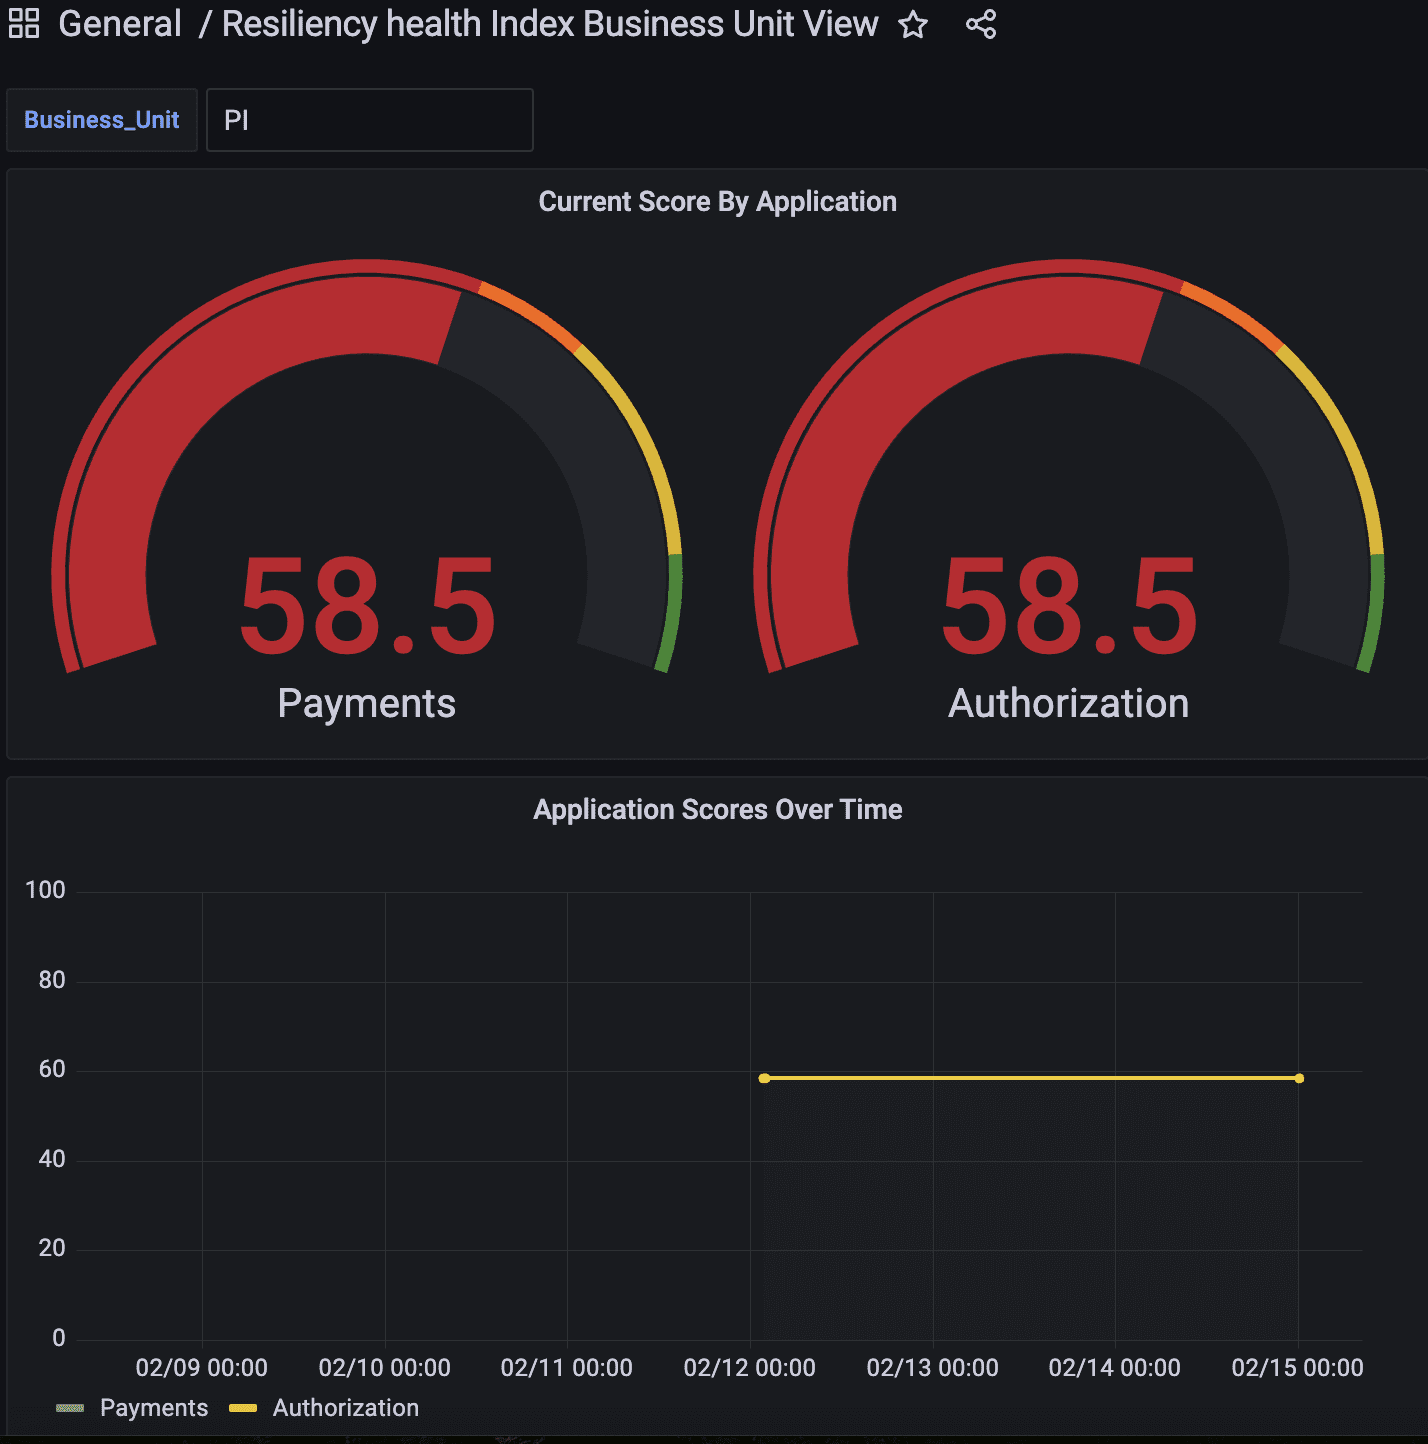
Figure-02
The next dashboard shows the scores of an individual app that is part of the PI LOB. It shows the aggregate application score, the aggregated category and control weights for the application, and the individual rule scores and details.
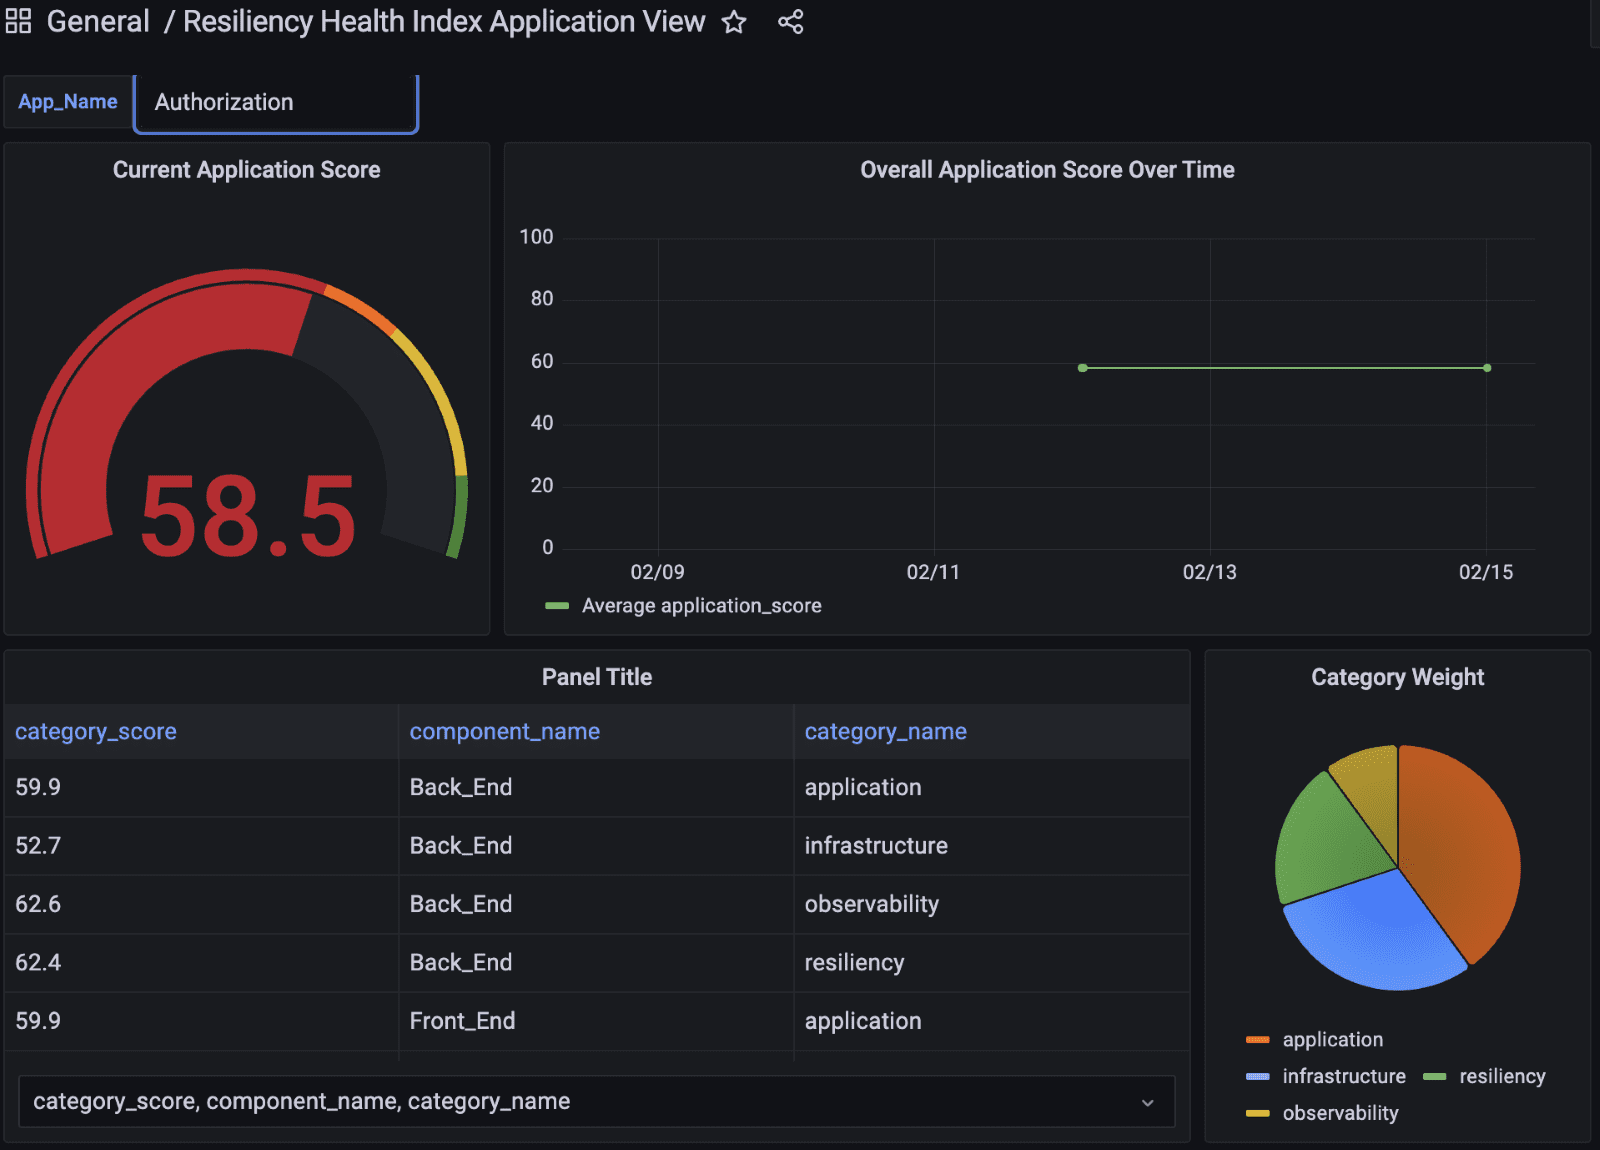
Figure-03
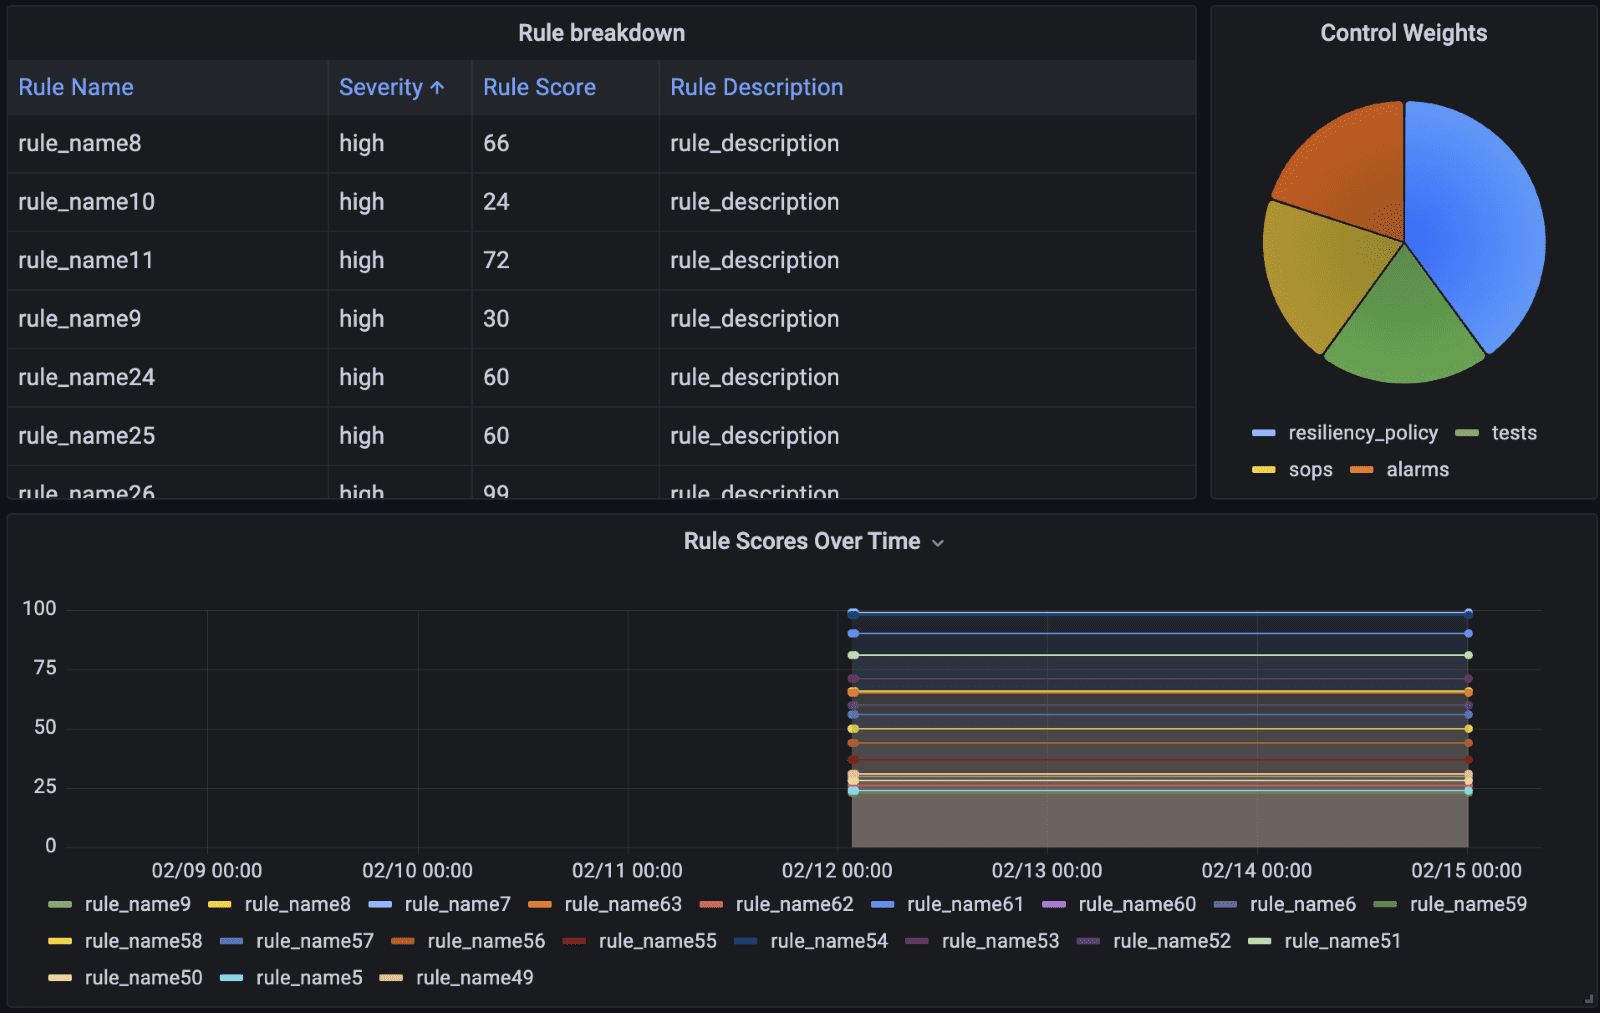
Figure-04
Components
- AWS Lambda – The core logic of the engine of the solution runs on Lambda
- AWS Step Functions – AWS SDK calls to pull configuration, write result data out, and orchestrate the calls to the core engine are all managed by an AWS Step Functions State Machine
- VR Scoring Engine Solution – This solution is used to adjust rule scores based on a weight defined for the given rule. See the Scoring Engine solution playbook for more details.
- DynamoDB – The Primary data store for output data, historic data, and configuration for the solution
- OpenSearch – The secondary data store for output data and historic data.
- AWS Managed Grafana – Used for data visualization and dashboarding
How it works
Before implementing the solution it is important that we first understand and identify the rules in your library, then categories them, and then create the rules and assign them to the application.
Applications, rules and steps are registered in the DynamoDB table. Rules are then associated with the application. Steps are then associated with each rule. The steps define what task should be accomplished. The sum of all steps in a rule, generate a single score. Rules and steps are written in such a way that the code is loaded dynamically into the Step Function and can be daisy-chained together to enable a wide variety of functions.
Below is a graph of how the Resiliency Health Index engine and dashboard fit into the wider ecosystem.
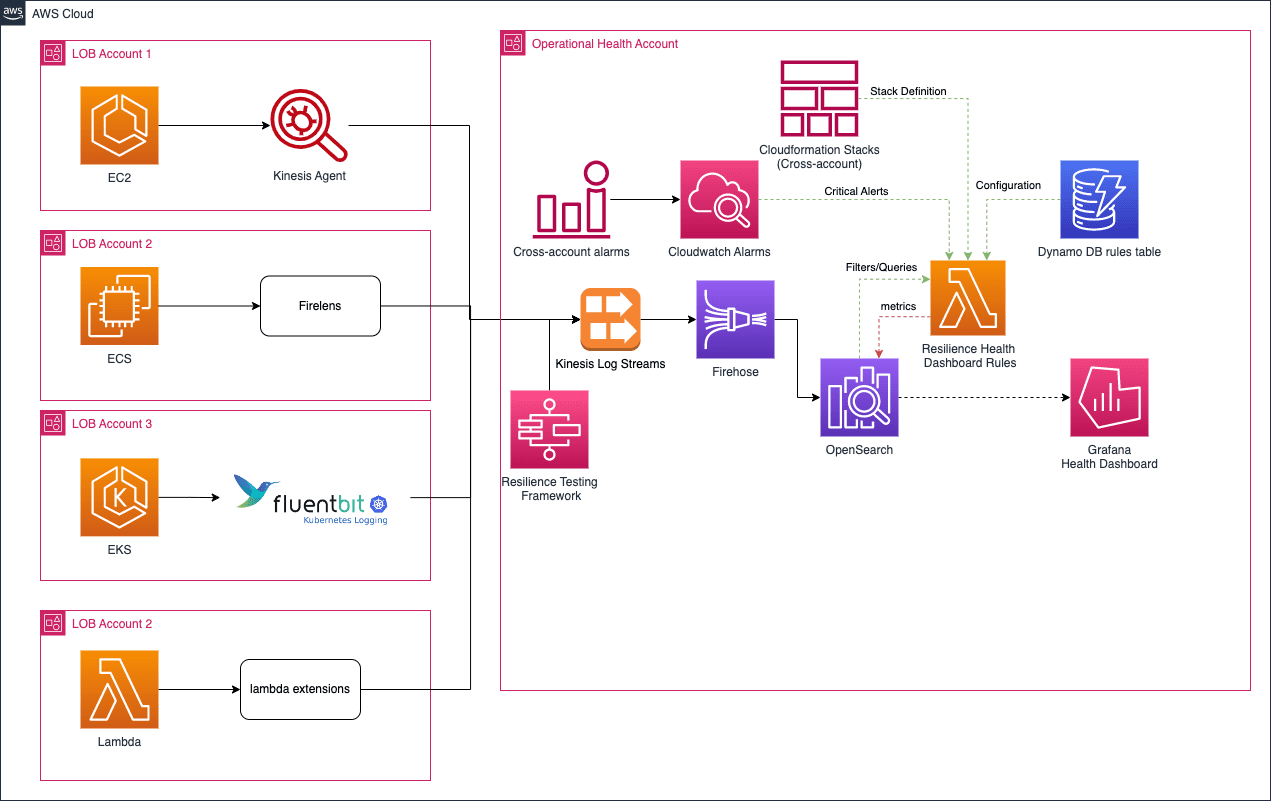
Figure-05
Below is a graph of how the State Machine itself works for the Rules Engine Step Function.
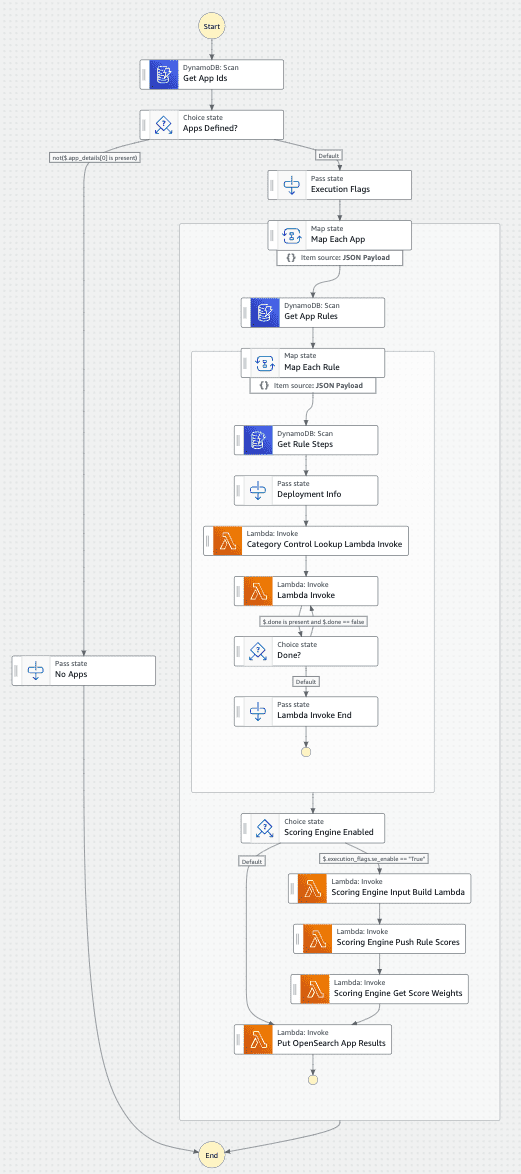
Figure-06
Last, to zoom in on the “invoke step runner lambda” step shown in the above chart, this is the internal function of the step runner. This logic is handled recursively by the state machine, and a “done” flag is added during the update step that tells the state machine to exit if the step that was run was the last step.

Figure-07
Blueprint
The Blueprint has a complete rules engine and an example step. The library of steps needs to be built out further to match some of the capabilities mentioned in this Playbook.
Benefits
This solution allows Executives to design custom scoring logic which helps them to centralize and visualize the progress of separate teams and apps from a Resilience perspective. This can be a powerful tool which allows executives to objectively analyze the state of the company’s resilience efforts and decide how to prioritize efforts related to resilience.
End Result
The implementation and continued usage of the Resiliency Health Index solution can help to ensure that a company’s cloud efforts are successful. Having well tested and resilient apps deployed ensures that the customers of a company’s cloud applications are consistently satisfied and have a good user experience, and results in overall higher satisfaction with the cloud solutions. A tool like Resiliency Health Index being applied will help a company meet those goals by allowing teams to visualize how well they are doing with resilience, and helping executives make decisions about where to allocate resources to help with resilience.