

Overview
In today’s complex microservices architectures, effective observability through distributed tracing is crucial for maintaining system performance and reliability. However, implementing comprehensive tracing across codebases presents significant challenges: determining optimal trace placement, understanding call flows, and ensuring coverage without performance degradation. Manual instrumentation is time-intensive, error-prone, and often results in inconsistent or insufficient coverage that leaves critical system behaviors unobserved.
Traditional approaches to distributed tracing instrumentation require developers to manually identify and instrument key points in their code. This process demands deep understanding of application flow, significant time investment, and specialized expertise in observability best practices. Many teams struggle with over-instrumentation that impacts performance or under-instrumentation that misses critical insights. The result is often incomplete visibility during production incidents when observability matters most.
To address these challenges, we introduce the Trace Injection Advisor, an AI-powered solution that combines intelligent code analysis with dynamic call tracing to provide comprehensive guidance on optimal trace placement. Our solution features two complementary components: an AI-powered Source Analyzer that identifies critical trace points based on configurable priorities, and a dynamic Call Tracer that maps complete function call flows to understand application behavior patterns.
The Source Analyzer leverages advanced AI models (including Anthropic Claude 3 Sonnet and Meta Llama 3.2) to analyze Python source code and recommend optimal locations for trace injection based on priorities like exception handling blocks, conditional branches, external resource interactions, and performance-critical code paths. The Call Tracer dynamically follows function calls across files and modules, building comprehensive call trees that reveal how application components interact. Together, these tools provide developers with intelligent, data-driven guidance for implementing effective distributed tracing strategies.
Through our Trace Injection Advisor solution, development and SRE teams can dramatically reduce the time and expertise required to implement comprehensive observability. Instead of manual guesswork, teams receive AI-generated recommendations backed by thorough code analysis, leading to more effective tracing strategies, better incident response capabilities, and improved system reliability.
Prescriptive Guidance
Before diving into the Trace Injection Advisor, it is important to acknowledge the following terminology.
Definitions
- AI Model – Large language model used for intelligent code analysis, supporting multiple providers including AWS Bedrock
- AST (Abstract Syntax Tree) – Tree representation of source code structure used for code analysis
- AWS Bedrock – Amazon’s managed AI service platform for accessing foundation models
- Call Tracer – Component that dynamically traces function calls across files to build execution flow maps
- Entry Point – Starting function or method from which call tracing begins
- FastHTML – Rendering framework used for interactive trace visualization
- Formatter – Component responsible for converting analysis results into human-readable formats
- Instrumentation – The practice of adding monitoring, logging, measurement, and tracing capabilities to systems, applications, and infrastructure to collect data about their performance, behavior, and health.
- Observability – The ability of IT operations to understand the internal state and behavior of a system based on the external outputs it produces
- Jinja2 – Template engine used for flexible output formatting
- Search Paths – Directories where the tracer looks for external modules and dependencies
- Source Analyzer – AI-powered component that identifies optimal locations for trace statement placement
- Trace Injection – The process of adding observability instrumentation to specific code locations
- Tracing Priorities – Configurable criteria used by AI to identify critical locations for instrumentation
Strategy
When faced with implementing distributed tracing across complex Python applications, development teams need systematic approaches for identifying optimal instrumentation points. Manual analysis of large codebases is time-consuming and often misses critical trace opportunities. The Trace Injection Advisor solution uses AI-powered analysis and dynamic call tracing to provide data-driven recommendations that eliminate guesswork and ensure comprehensive coverage.
The Trace Injection Advisor is composed of three main components: Tracing (dynamic call flow mapping), Analysis (AI-powered code examination), and Formatting (flexible output generation). This solution focuses primarily on tracing and analysis capabilities, with configurable rendering and formatting options to integrate with existing development workflows.
During Analysis, the Source Analyzer builds an AST representation of the code and uses AI models to evaluate each section against the configured priorities. The AI provides specific recommendations including function names, code blocks to instrument, rationale for each recommendation, and suggested trace information to capture. Simultaneously, the Call Tracer can map the complete execution flow from any entry point, showing how functions call each other across modules and files, revealing the application’s runtime behavior patterns.
For more information on what each component does, see the details below.
Tracing
The Call Tracer component provides dynamic analysis capabilities, mapping complete function call flows to understand application execution patterns. This component takes a different approach from static analysis, actually following the call chain from specified entry points to build comprehensive execution trees.
Key features include cross-file call resolution that follows imports and searches directories, import mapping that handles both absolute and relative imports, class attribute analysis to resolve method calls on objects, and circular reference prevention through visited function tracking. The system supports configurable search paths for finding external modules and generates unique IDs for each call node to enable tree navigation.
Analysis
The Source Analyzer serves as the intelligent core of our solution, leveraging AI models to provide data-driven recommendations for trace placement. This component begins when source code (file or directory) is provided for analysis, i.e., from the Call Tracer. The analyzer parses the code into an AST representation, then uses configured AI models to evaluate the code structure against predefined tracing priorities.
The analysis workflow follows a structured approach, with the AI model examining code patterns and providing comprehensive recommendations. The system supports multiple AI models through AWS Bedrock, including Anthropic Claude 3 Sonnet and Meta Llama 3.2, with configurable parameters for temperature, retry logic, and token limits. Each model brings different strengths: Claude excels at detailed code analysis and contextual understanding, while Llama provides efficient processing for large codebases.
For each identified location, the AI provides detailed analysis including the specific function/method name, fully qualified name for context, exact code blocks to instrument, clear rationale explaining why tracing is beneficial, and recommended trace information to capture (parameters, return values, timing, etc.).
Best Practices / Design Principles
Choice of AI Model
Model selection significantly impacts analysis quality, accuracy, and cost. The Trace Injection Advisor supports multiple AI models through AWS Bedrock, providing flexibility to choose models based on specific requirements and constraints.
Anthropic Claude 3 Sonnet excels at detailed code analysis and provides a nuanced understanding of complex codebases. It offers excellent reasoning capabilities for identifying subtle trace opportunities and provides detailed rationale for recommendations. This model is ideal for comprehensive analysis of critical applications where accuracy is paramount.
Meta Llama 3.2 3B Instruct provides efficient processing with faster response times and lower token costs. While less detailed than Claude, it offers solid performance for large-scale code analysis and bulk processing scenarios. This model suits development teams processing extensive codebases with cost constraints.
Organizations requiring on-premises deployment or custom fine-tuning may prefer self-hosted models. The solution’s modular architecture supports custom model implementations, enabling integration with organization-specific AI infrastructure while maintaining the same analysis capabilities.
Configuration Management
The solution uses YAML-based configuration files that centralize all system settings, making it easy to customize behavior for different projects and environments. Key configuration areas include AI model selection and parameters (temperature, retry logic, token limits), tracing priorities and their relative importance, formatter selection and template paths, and AWS region configuration for Bedrock access.
Search Path Strategy
Effective search path configuration is crucial for accurate call tracing across complex Python projects. The Call Tracer requires proper search paths to resolve imports and follow function calls across modules. Best practices include adding project root directory for local module resolution, including virtual environment site-packages for dependency analysis, and specifying custom library paths for proprietary modules.
Search path ordering affects resolution priority, with earlier paths taking precedence. This allows override behavior for testing or development scenarios. The system caches parsed modules across search paths to improve performance during analysis of large codebases.
Output Integration
The flexible formatting system enables integration with various development tools and workflows. Teams can customize output formats to match their documentation standards, integrate with existing observability tooling, and automate report generation through CI/CD pipelines.
For interactive analysis, the FastHTML renderer provides web-based exploration of call trees, while Streamlit integration offers dashboard-style visualization with filtering capabilities. Custom formatters can generate outputs compatible with specific monitoring platforms or development tools.
Error Handling
The system implements robust error handling with configurable retry logic, supports both single-file and directory analysis modes, and outputs results in structured JSON format for downstream processing. Advanced features include token usage tracking for cost management, validation of AI model responses, and flexible configuration through YAML files.
Formatting
The Trace Injection Advisor includes a flexible formatting system that converts analysis results into actionable reports. The formatting component supports multiple output strategies through a pluggable architecture, allowing teams to customize output formats for their specific workflows and tools.
The system includes two primary formatting implementations: Coded Formatter that implements formatting logic directly in Python code for maximum control and customization, and Jinja2 Formatter that uses template-based formatting for easier modification without code changes. Both formatters convert JSON analysis results into well-structured Markdown reports with consistent formatting.
The formatting output includes comprehensive sections covering model information and configuration details, executive summary of analysis findings, priority-based recommendations organized by tracing categories, detailed code block analysis with specific instrumentation guidance, and token usage statistics for cost tracking and optimization.
For trace visualization, the Call Tracer integrates with multiple rendering systems including FastHTML Renderer for interactive web-based trace trees with expandable nodes and detailed call information, and Streamlit Renderer for dashboard-style visualization with filtering and search capabilities. These rendering options make it easy to explore complex call trees and understand application execution patterns.
Security Concerns
Access control for the Trace Injection Advisor primarily relies on filesystem permissions and AWS credentials management. Since the solution analyzes source code locally, ensure proper file system access controls and secure handling of analysis results that may contain sensitive code information.
The two AI models initially integrated perform interactions through AWS Bedrock. For Amazon Bedrock, see Data Protection – Amazon Bedrock. With Amazon Bedrock, the main security consideration involves data transmission to third-party model providers. According to AWS Bedrock’s data protection policies, “Amazon Bedrock doesn’t store or log your prompts and completions. Amazon Bedrock doesn’t use your prompts and completions to train any AWS models and doesn’t distribute them to third parties.” Models are further isolated into a “Model Deployment Account”, to which model providers lack access.
When using self-hosted models, data privacy concerns are eliminated since all processing occurs within the organization’s infrastructure. This approach provides complete control over sensitive code analysis while maintaining the solution’s analytical capabilities.
Additional security considerations include secure storage of configuration files containing API keys, audit logging of analysis activities for compliance, and encryption of analysis results when stored persistently. Teams should implement appropriate data classification policies for code analysis outputs.
Cost and Usage
Source code analysis typically costs between $0.05-$0.15 per file depending on model choice and file complexity. Analysis time ranges from 10-30 seconds per file for most codebases. Cost and performance are primarily influenced by AI model selection, code complexity and file size, number of configured tracing priorities, and retry logic configuration.
Cost Optimization Strategies:
- We recommend using the Claude 3 Sonnet implementation provided by default
- Use Meta Llama models for large-scale processing
- Configure appropriate token limits to prevent runaway costs
- Use source file filtering to exclude non-critical files
- Monitor token usage through built-in tracking capabilities
Call tracing operations are computationally local and don’t incur AI model costs, making them suitable for iterative analysis and large codebase exploration. The combination of both components provides comprehensive analysis with controlled costs.
Trace Injection Advisor
The Trace Injection Advisor consists of two main analysis components working in concert: the Call Tracer for dynamic execution flow mapping and the Source Analyzer for AI-powered static analysis. Both components integrate through a shared configuration system and flexible output formatting pipeline.
Trace Injection Advisor components are written in Python, so they can run anywhere Python is installed.
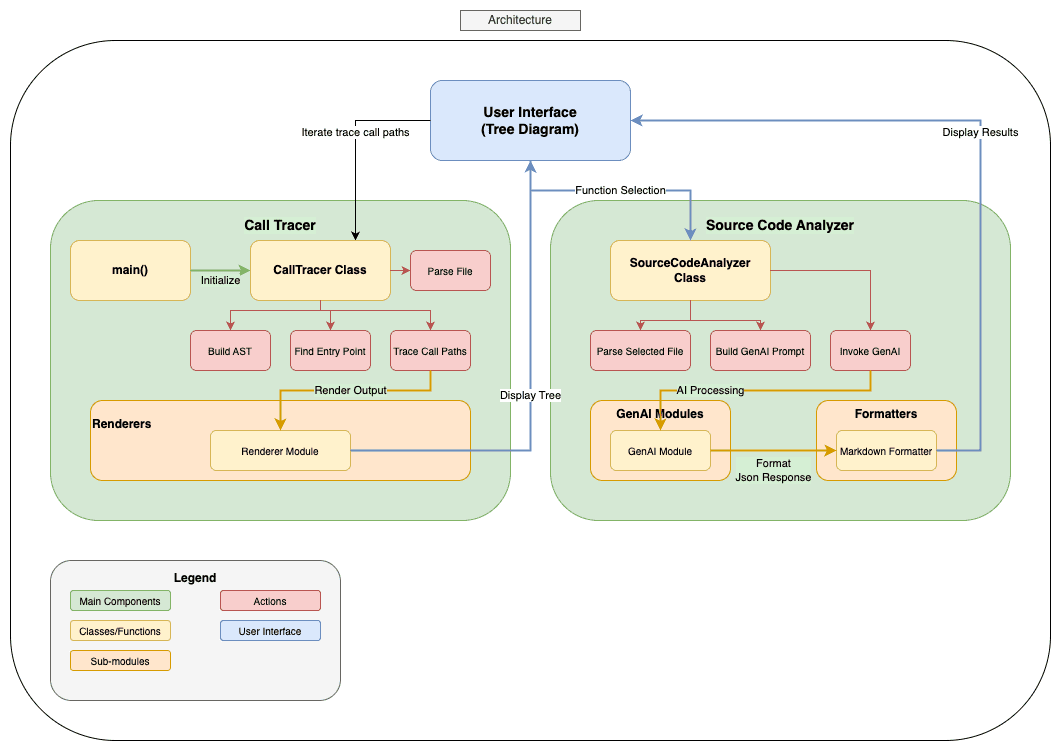
Figure-01
Components
Numbered list of services used in this section.
- Call Tracer – Dynamic call flow analysis with cross-module resolution and tree generation
- Source Code Analyzer – AI-powered static code analysis with intelligent trace recommendation
How it works
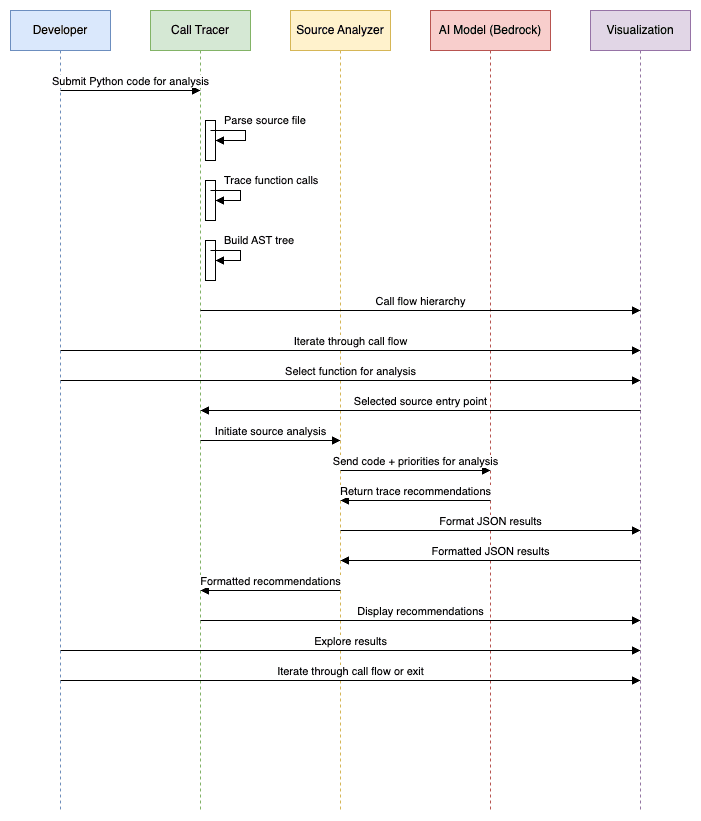
Figure-02
Call Tracing Flow
The process begins with the Call Tracer. Dynamic call tracing operates by mapping execution flows from specified entry points. Developers provide a source file, entry point name, and a list of search paths, and the Call Tracer builds a complete execution tree showing how functions call each other across modules.
The tracer follows imports, resolves function calls across files, and handles various call patterns including method calls, module functions, and nested attributes. The resulting call tree reveals application execution patterns and helps identify additional trace opportunities missed by static analysis.
Interactive visualization through FastHTML or Streamlit renderers enables exploration of complex call trees, making it easy to understand application flow and plan comprehensive tracing strategies.
Source Analysis Workflow
The source analysis process begins when developers specify source files or directories for examination, or from Call Tracer UI. The Source Analyzer loads the specified files, parses them into AST representations, and prepares analysis prompts based on configured tracing priorities.
The AI model analyzes each source file section against the configured priorities, identifying critical locations for trace injection. The model provides comprehensive recommendations including specific function names, code block locations, rationale for each recommendation, and suggested trace information to capture.
Results are processed through the formatting pipeline, generating structured Markdown reports that development teams can use to guide their instrumentation efforts. The flexible formatter architecture supports custom output formats and integration with existing development workflows.
Blueprint
The GitHub repo is here.
Benefits
- Reduced engineering effort in adding tracing to applications, making it more cost effective and easier to adopt
- Improved availability of systems by reducing the barrier to entry for distributed tracing, which also increases the observability of systems
- Provides consistent, repeatable results that support audit trails and compliance documentation for regulated industries
- Systematic identification of instrumentation gaps enables proactive improvement of observability coverage before production issues occur
- AI-Powered Intelligence, leveraging advanced AI models (Claude 3 Sonnet, Meta Llama 3.2) to identify optimal trace locations with detailed rationale, eliminating guesswork and ensuring comprehensive coverage
- Dynamic Call Flow Analysis maps complete execution paths across modules and files, revealing hidden application interactions and dependencies that static analysis alone cannot discover
- Multi-Model AI Support provides flexible integration with multiple AI providers including AWS Bedrock, enabling cost optimization and performance tuning based on organizational requirements
- Factory pattern implementation for formatters, renderers, and AI models enables rapid customization and integration with existing enterprise toolchains
- AI-generated suggestions include specific rationale, code locations, and recommended trace information, accelerating implementation decisions
End Result
The goal of the Trace Injection Advisor is to democratize effective distributed tracing implementation while significantly advancing organizational observability maturity. This solution enables development teams to quickly identify and instrument optimal trace points without requiring specialized observability expertise, fundamentally transforming how enterprises approach system instrumentation.